Radiosonde - Weather Balloon Decoding and Station Optimization.
Navigation: home
Jume 2024. Ignore this page
Docker is all the rage now. Also there is a new way to run the Airspy that tbg is not up to speed on.
Radiosondes or weather balloons are launched around twice a day from a lot of different locations around the world.
You can visit sondehub and find your location to see what flights are going on around you. Zoom out and find the little gray circle that is a launch site (usually near or on airports) and then right click on the circle and check out the frequency of launches and the history of flights from that site to see where sondes have landed in the past.
Its a lot of fun to track these flights and sometimes you can go to where they land and recover the sondes (scoring yourself a little GPS, temperature/humidity sensor and 400Mhz transmitter - many of which can run modified firmware and pressed into other uses. For example here is some RS41 firmware and DFM-17 mods
While recovering a sonde is lot of fun, this page is less about the chasing and recovering the sonde (there are many websites and Facebook groups dedicated to that aspect of the hobby) and more about setting up the station, improving and measuring changes to the station by getting more station centric data from the payload data stream.

Software -> auto_rx
There are a few different sonde decoder software packages that you can download. Some for Windows, some for Linux, some decode a lot of different models of sonde data, some only one or two. A quick Google search can guide you on them, this page is going to focus on the Linux only ‘radiosonde_auto_rx’ package.
You can run auto_rx on a Raspberry Pi 3/4 or x86 computer running Ubuntu or Debian. (Other distros might be possible, but I don’t have any experience with them).
The auto_rx people have done a great job writing up the code and installation guide, you can visit the wiki here: radiosonde_auto_rx wiki
Some notes: I am not a fan of Docker, so usually go with the native build. But that said, Im told Docker is the smoothest way to install and keep things updated.
Do note that auto_rx does not need a gui or desktop, so you can run a headless install on your computer and just use a web browser to view the auto_rx interface from any other computer / tablet on your local network.
The wiki native install guide is very clear and results in a smooth install. Just be sure to read all the way through before starting and don’t proceed to the next step if you get an error on the current step - I have not had any issues thus far following the native guide.
I recommend getting up and running with just the one RTLSDR v3 dongle at first. Do note that while the Airspy Mini and R2 SDR’s are sort of supported, its somewhat more complicated and fragile to get going and keep running and so I have not ventured into those hardware platforms. If you want to have a go at running them at some point in the future, the instructions are further down their Wiki
Also note that hardware like RSP1a, HackRF and other such SDR’s are not supported, only the NooElec and RTLSDR type receivers are supported out of the box at this time.
At first you can leave the SDR at its default serial number of usually 00000001 or what ever serial you have changed it to. You will need to know its sn# as part of the install so make note of it when you get to the step of running rtl_test.
Hardware
Antenna
Depending on how far away the sondes tend to float past your location will depend on the antenna you will need to hear their signal.
If you are very close by, a simple indoor vertical whip might be enough to get your first bit of data, but most people reading this want to push their range a bit more and so will run an outdoor antenna. There are only a few off the shelf options here. The sondes in use in North America transmit between 400Mhz and 406Mhz. There are not a lot of off the shelf antennas that are built pre-tuned for this range. (A lot more will be said about antennas further down the page). And yes, you are quite right, the discone will cover that range, but please keep reading….
A lot of people get started with a ham radio dual band 70cm/2m vertical. Many also press a typical wide band ‘scanner’ vertical antenna into use, and all are fine starter antennas.
After a lot of looking, I found this interesting antenna on Amazon
It has length adjustable elements top and bottom of a center loading coil.
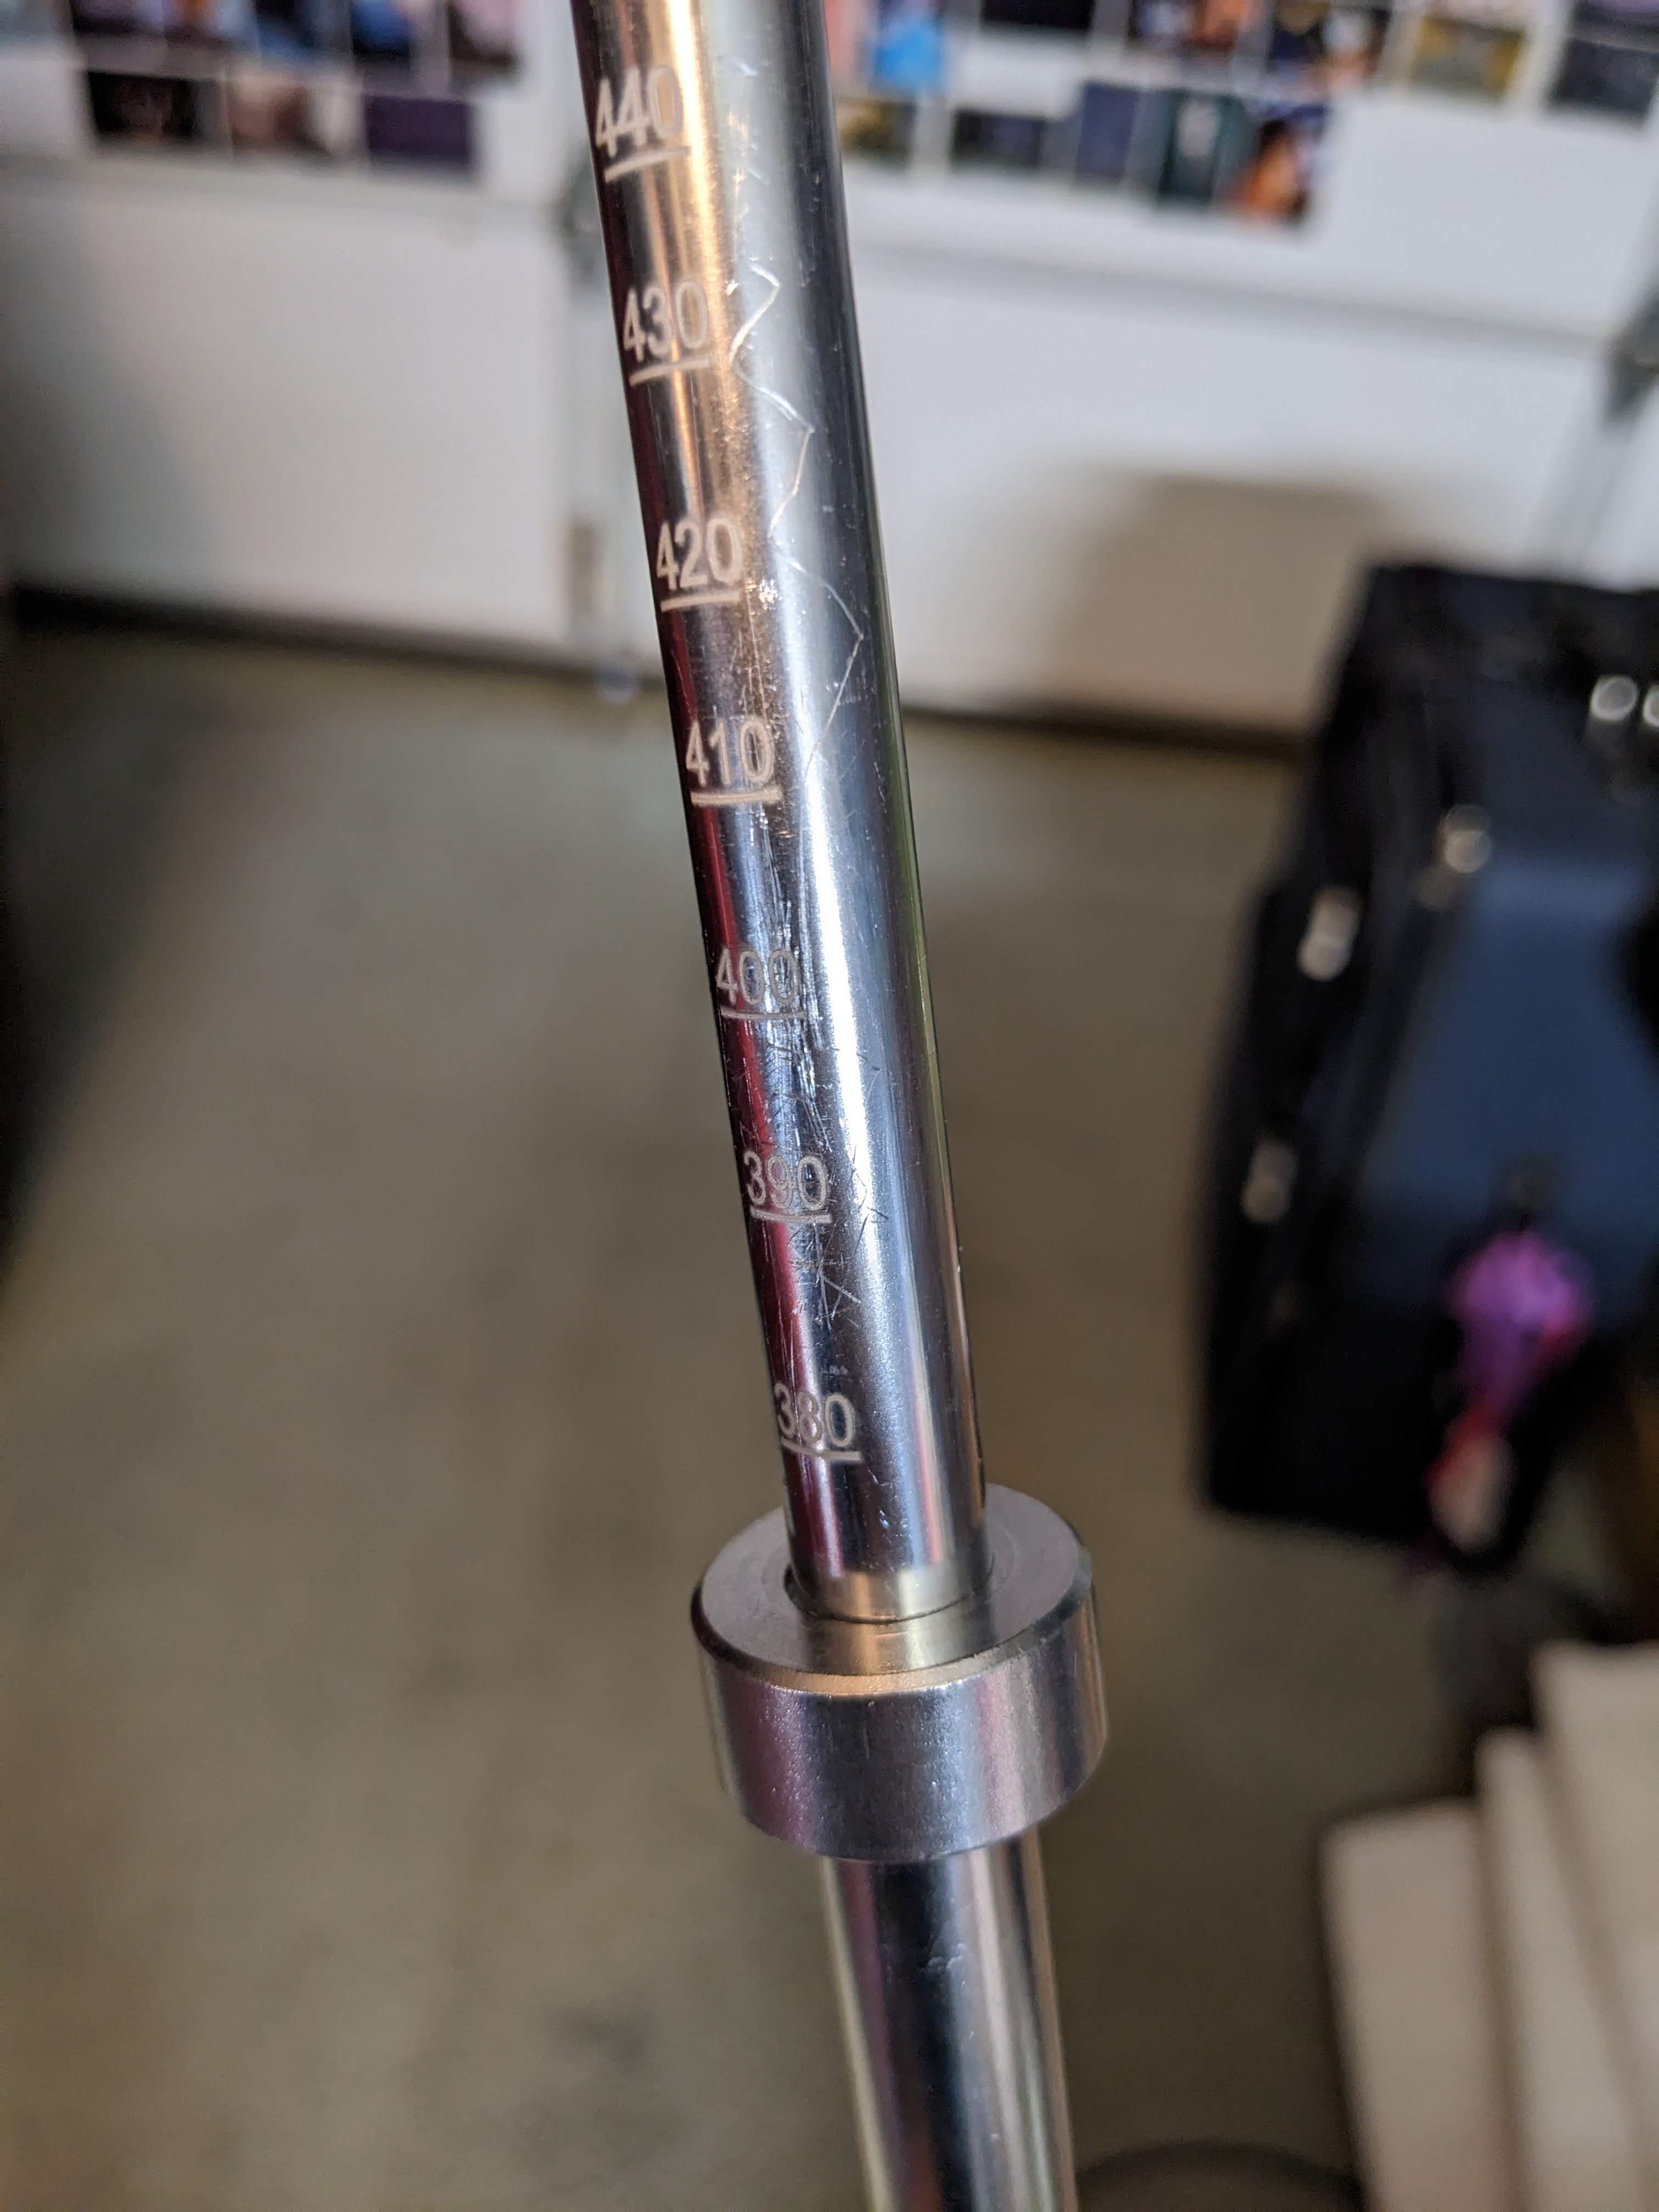
A few comments about this antenna.
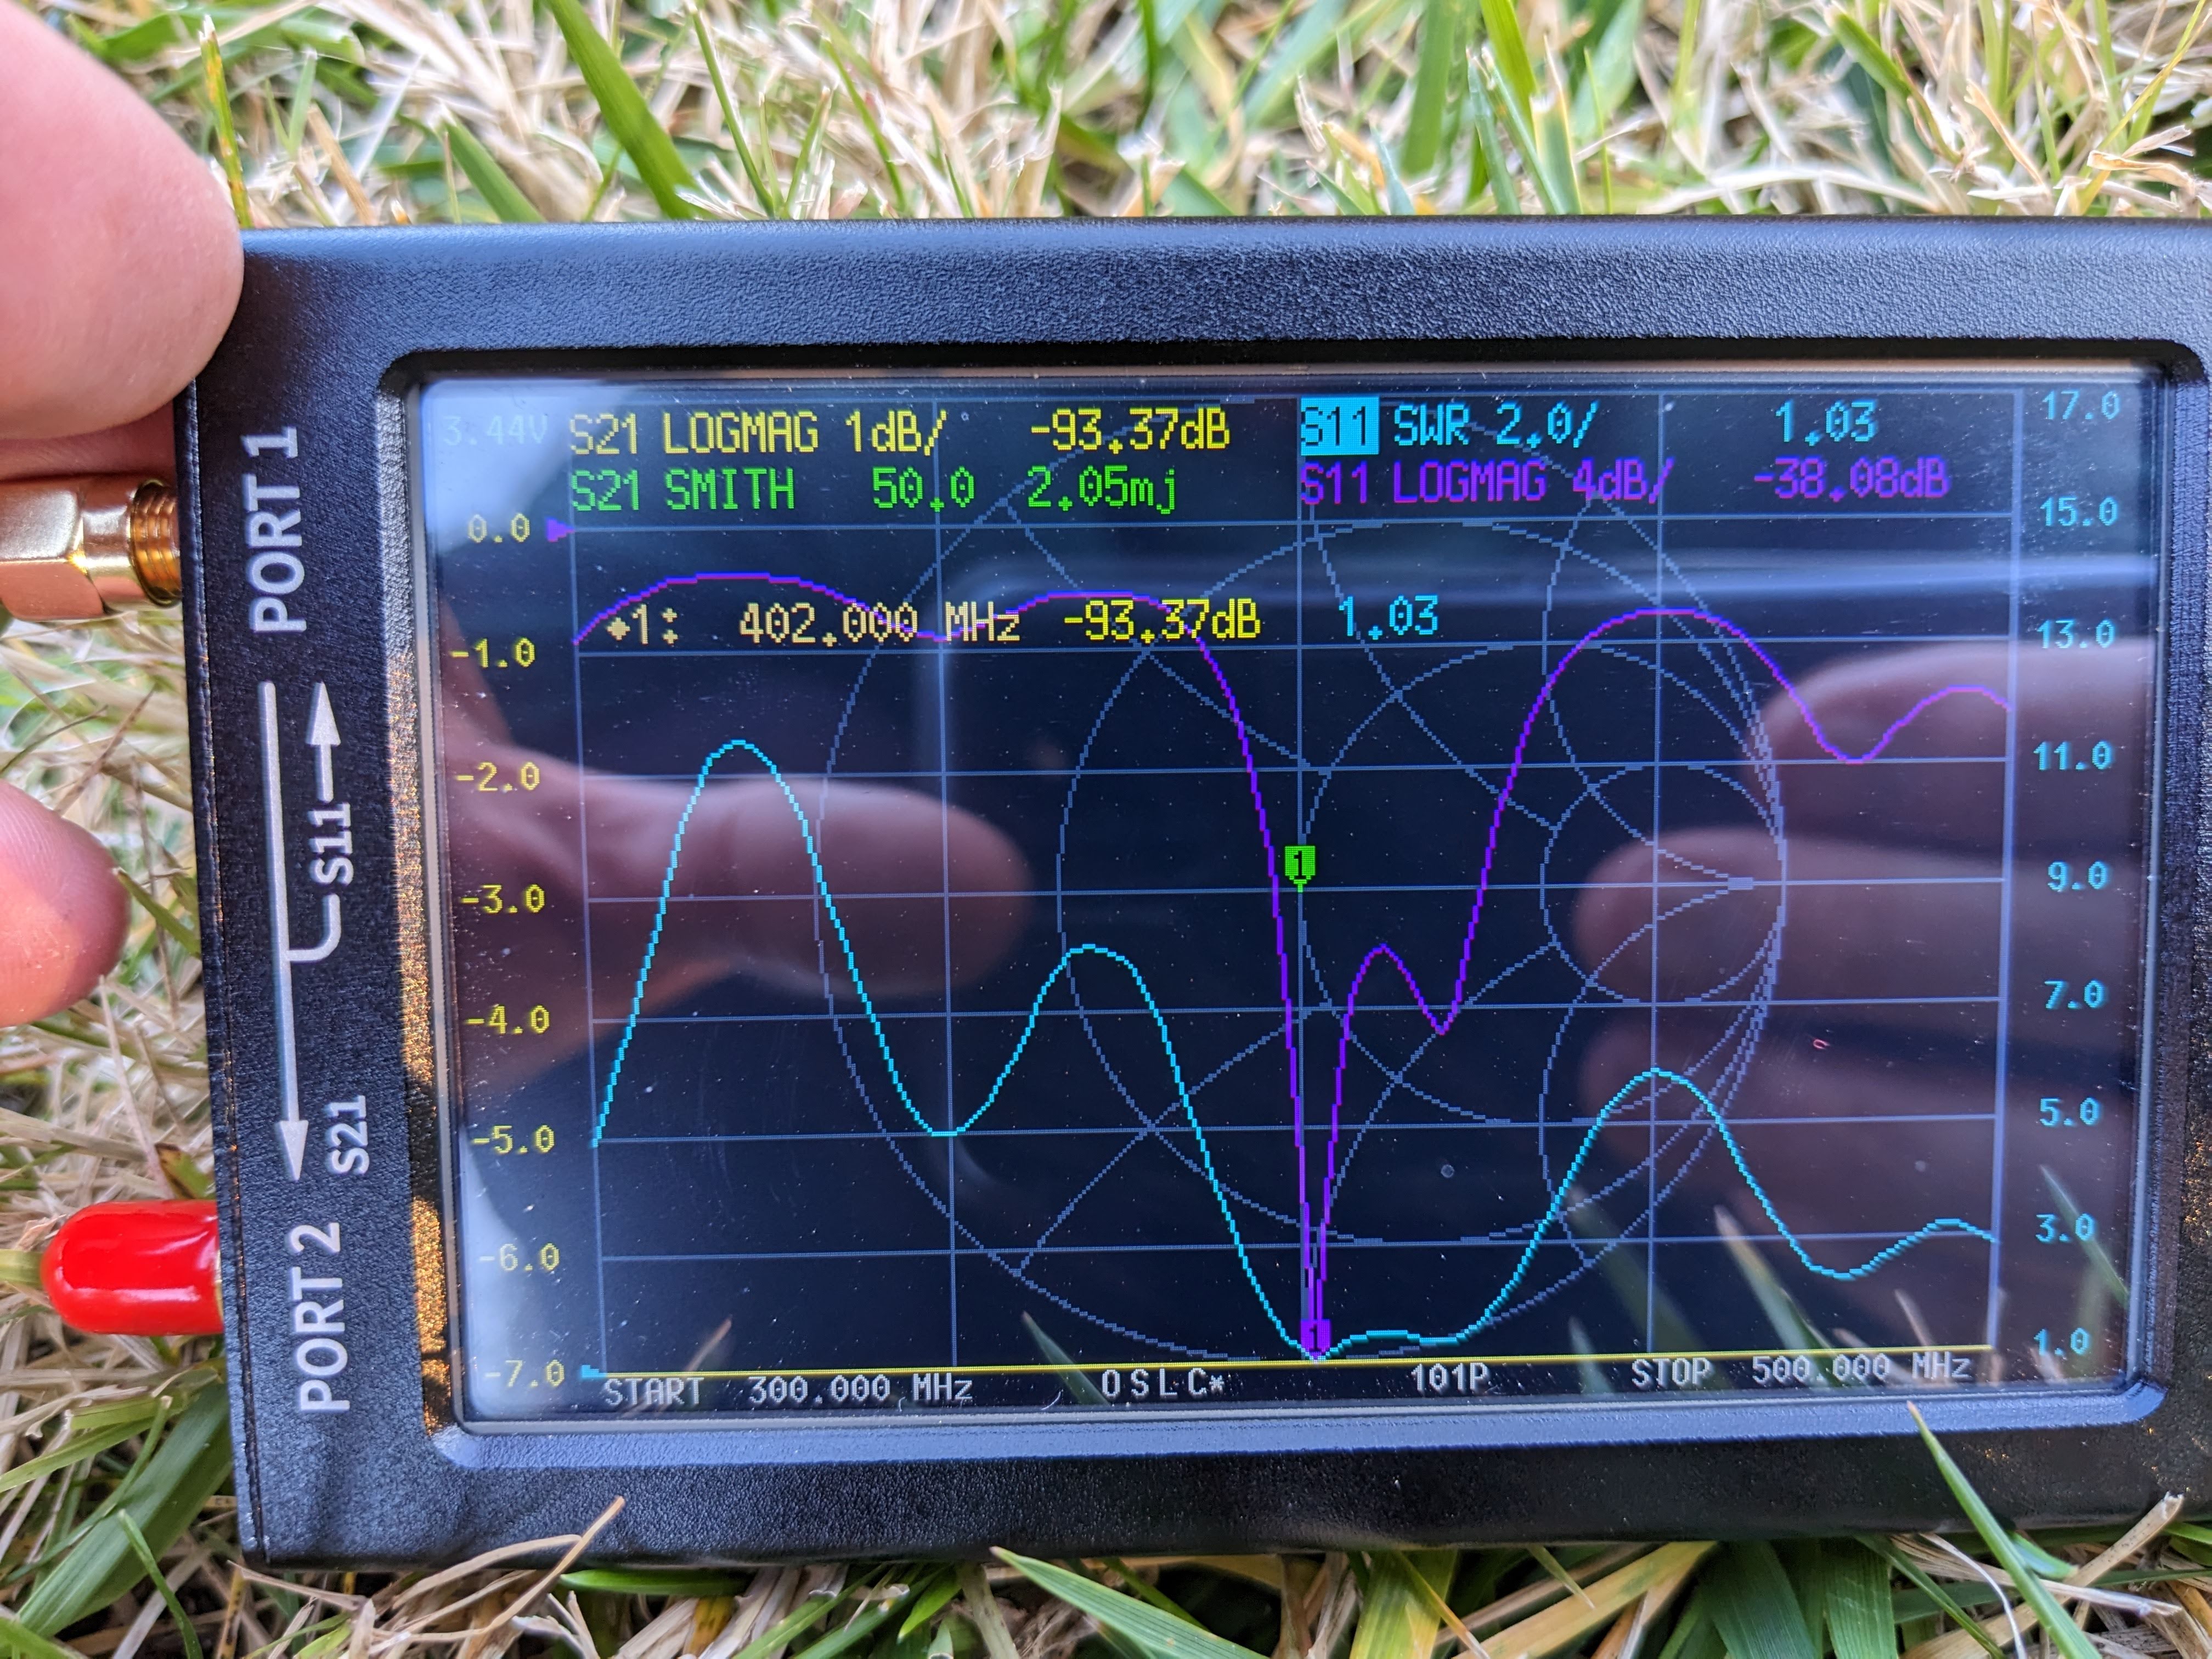
- The markings are not very accurate. You will need to own or borrow a NanoVNA to tune this antenna for 402Mhz. Just going by the markings wont get you anything like close to being tuned for the frequency you want.
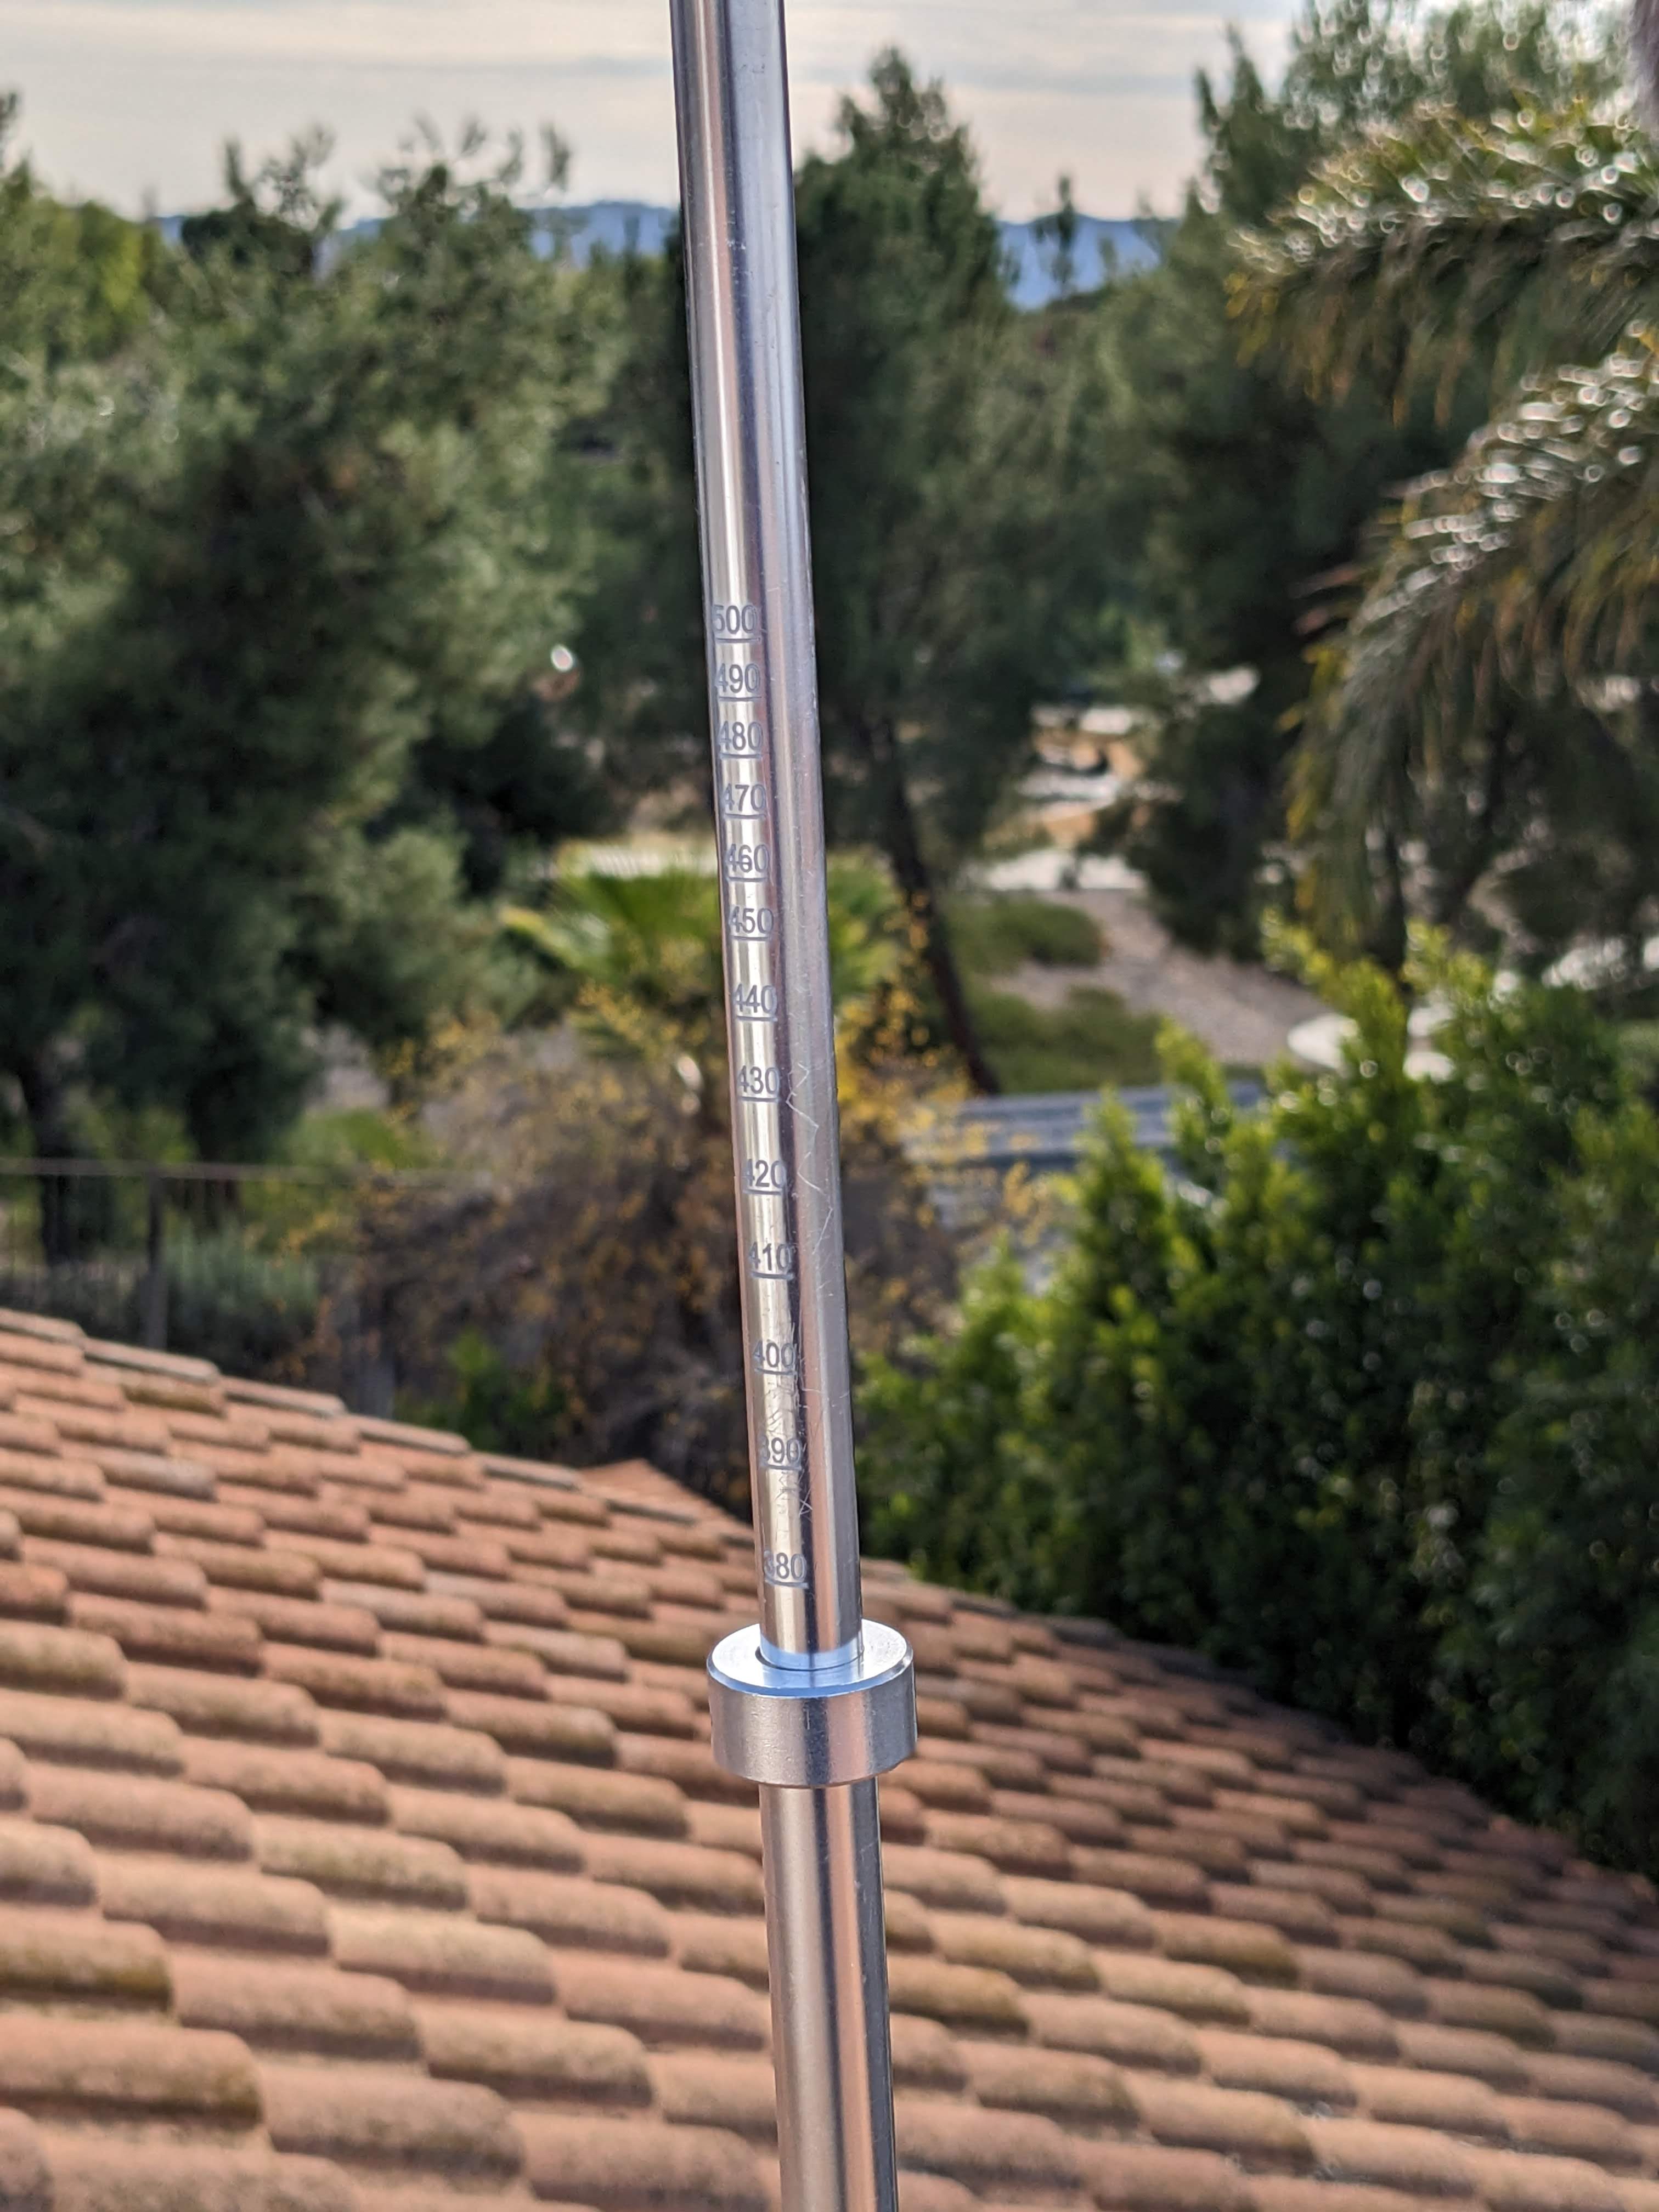
- Its a bit flimsy. Not an issue for me in mild Southern California weather, but just the same, once I had it tuned, I drilled and put pop rivets in each element. Time will tell how it holds up.
So far, after ~2 months testing, I am very happy with its performance from being barely at roof height in a pretty dense suburban install.
The key to your station performance is the antenna. Good gain and no major lobes or too much sky gain is very important.
SDR
The SDR type is pretty much pre-chosen for us.
The blue ADSB dongles are no good, they have a filter in them that will reject the sondes 400Mhz signal. The orange 978 or 1090 dongles are ok, they have an amplifier and no filter, so that will get you running Ok as well.
The Nooelec XTR SDR’s have been called out in the Facebook group as being more sensitive than the RTLSDR v3, but do note that they come with the downside of having a large center spike or spur and often two smaller ones on each side of the large center one. If your launch sites uses a sonde frequency on or even near those spurs, any ‘gain’ in sensitivity will be lost. I have seen this issue several times in helping people setup their stations with the XTR. Tip, if you want to use an XTR SDR use the sondehub website to see if the sondes in your area transmit close to any of the spikes to see if you are going to miss their signal.
The RadarBox airband dongle is so deaf at every frequency known that most have given up using them for any purpose.
A word on SDR sensitivity or noise figure.
Looking just at the SDR as the driver of the entire stations sensitivity is ‘Ok’ if the SDR is the only thing after antenna. But since this page is about eeking the most performance possible out of the antenna, then using an LNA or Low Noise Amplifier at the antenna is a must.
When you do that, then the system noise figure (which is the primary driver for sensitivity) will be set by the preamplifier closest to the antenna.
Adding more and more gain after that doesn’t necessarily help things and will generally lead to more intermodulation distortion.
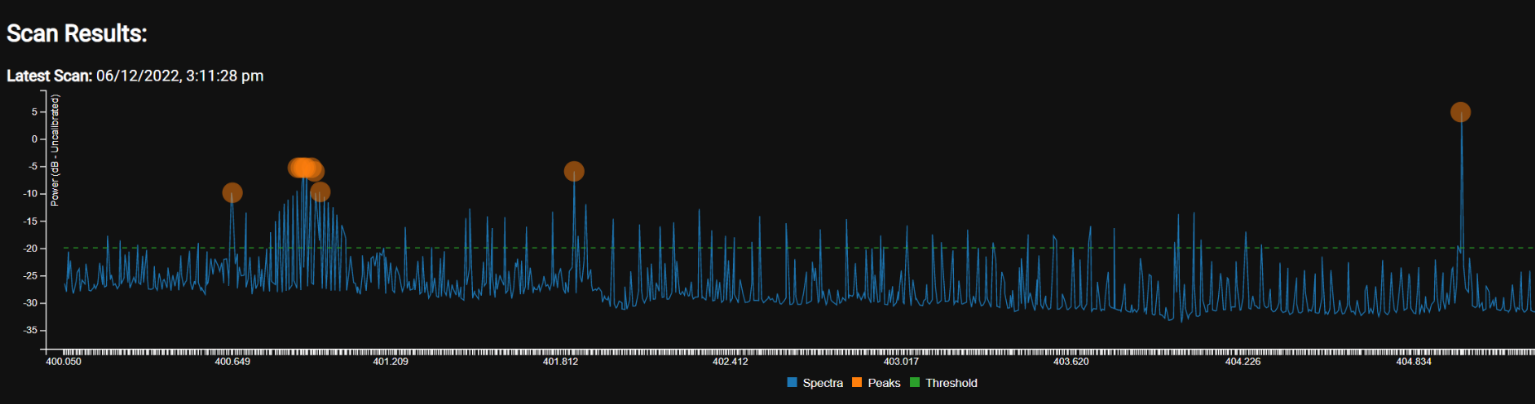
Its also important to look at the auto_rx spectrum now and then or an SDR waterfall that is using the same SDR and antenna.
Here is a site with very bad radio interference (RFI).
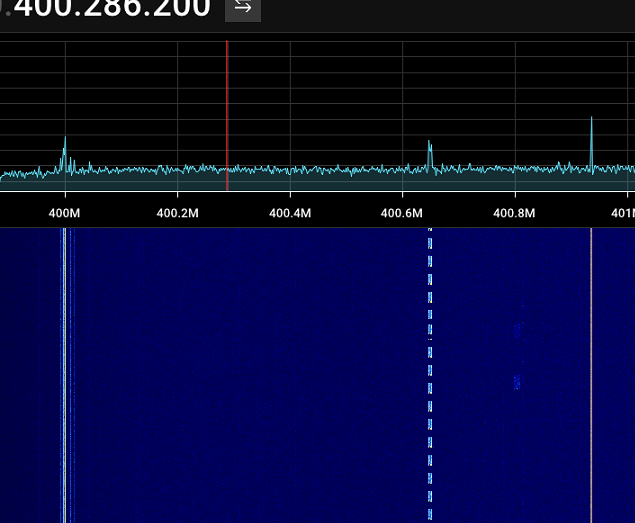
This is a snapshot from a different site on what the sonde waterfall pattern looks like.
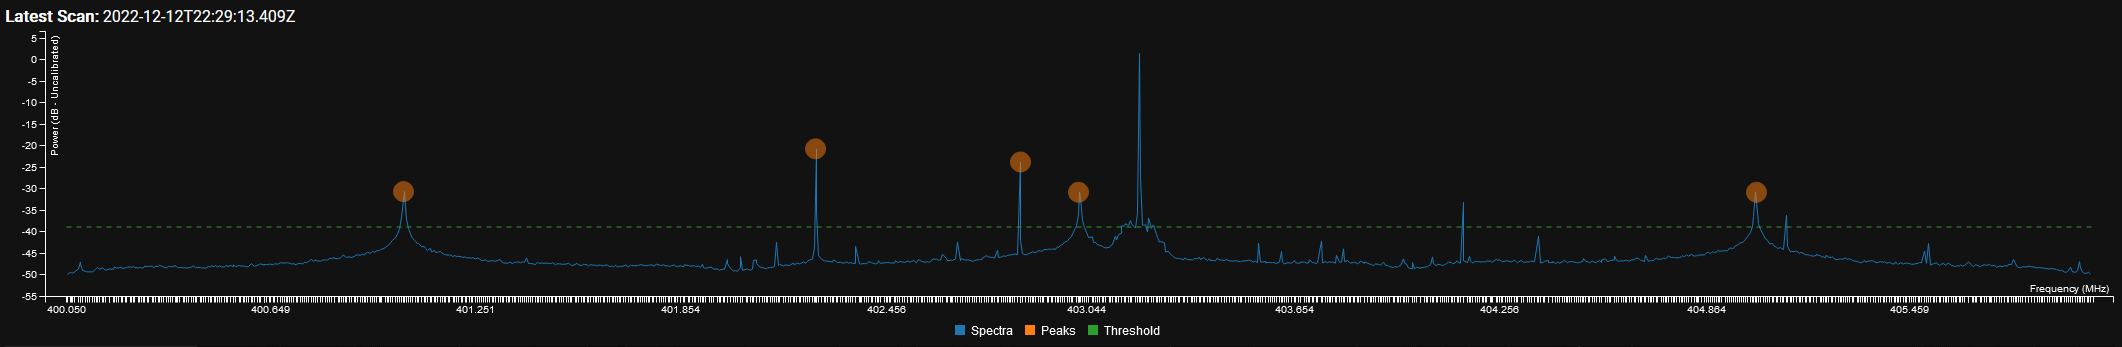
SDR spectrum with no antenna
There is a bit of talk - and not without cause - on the spikes that ‘naturally’ exist in the SDR output.
So lets take a look at the following SDR’s that are in typical use with auto_rx.
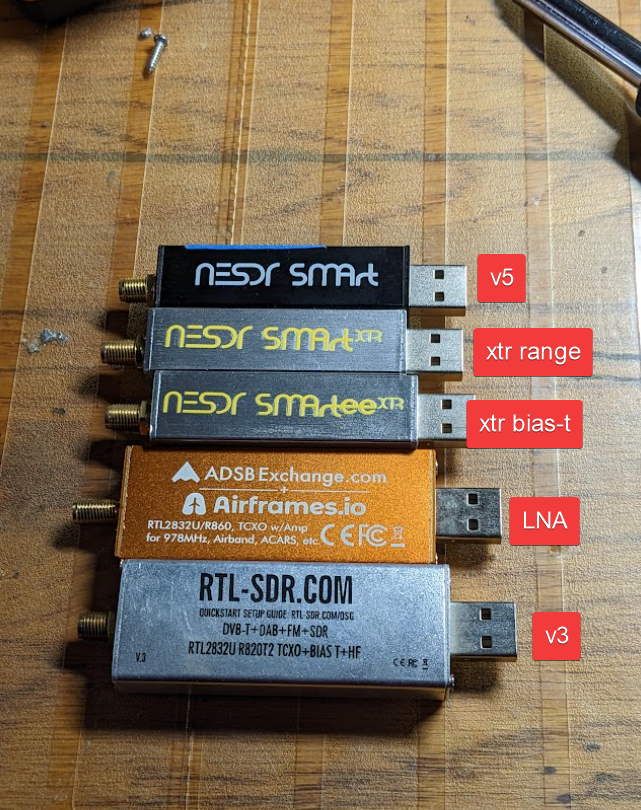
Now, lets take a look at each one without an antenna connected.
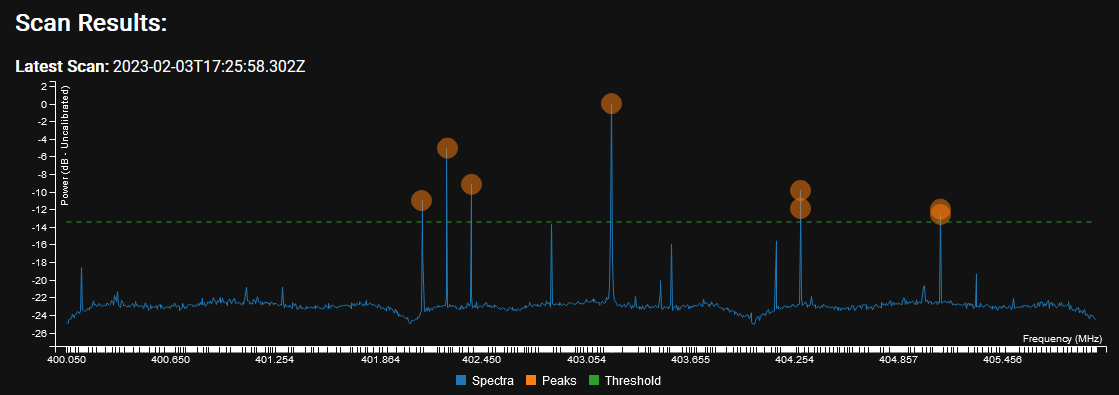
First the new kid on the block, the NooElec V5

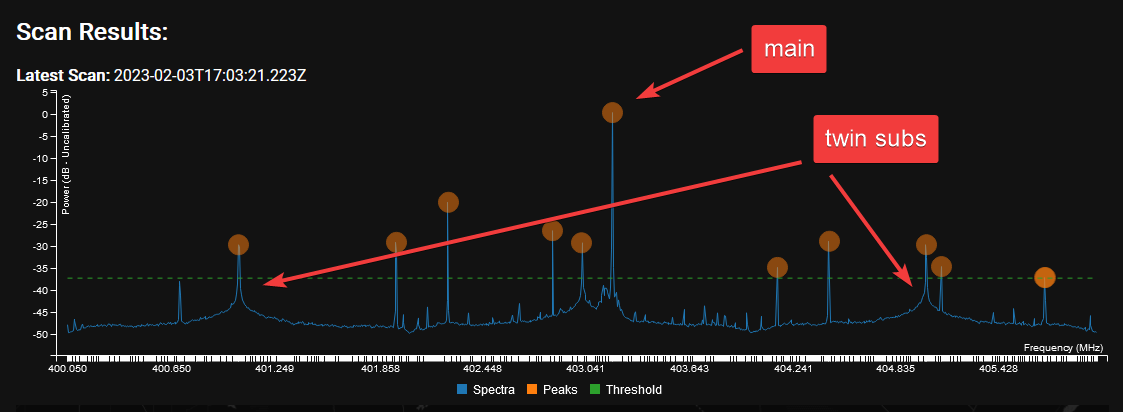
Next up is the NooElec with the extended receive range (not needed for radiosonde work, but this SDR has nice sensitivity at 400Mhz) For some, the two side spurs (honestly, they are so wide, you cant just call them spikes at this point) will not be an issue. For some locations, they will be if your sondes are on those three (including the main spike) frequencies. Keep reading, more to come on this issue.
Next is the NooElec XTR but with a permanently on (physical) Bias-T output of just under 5v. The added Bias-T makes things a bit ugly - remember, no antenna on these tests, all done within minutes of each other - so once again, SDR generated (from the USB port power) Bias-T makes things ugly, keep reading for more on this.
Next up, an SDR that perhaps not many in the radiosonde world have seen, but is super popular in the aircraft monitoring world.
Its an RTL2832U SDR with a built in LNA (Low Noise Amplifier) right on the SDR. Bias-T is not an option with this SDR (yay), and there is real concern on the usefulness on having an amplifier right at the SDR after all the noise of the coax is added and ‘worse’ if you have an LNA at the antenna (the correct place to put it), but I include it here as there are a lot of aircraft enthusiasts that also track sondes.
Clearly, that extra gain brings some birdies with it.
Last up, the old faithful.
RTLSDR v 3. The software bias-T is turned off for this test (as it should be all the time).
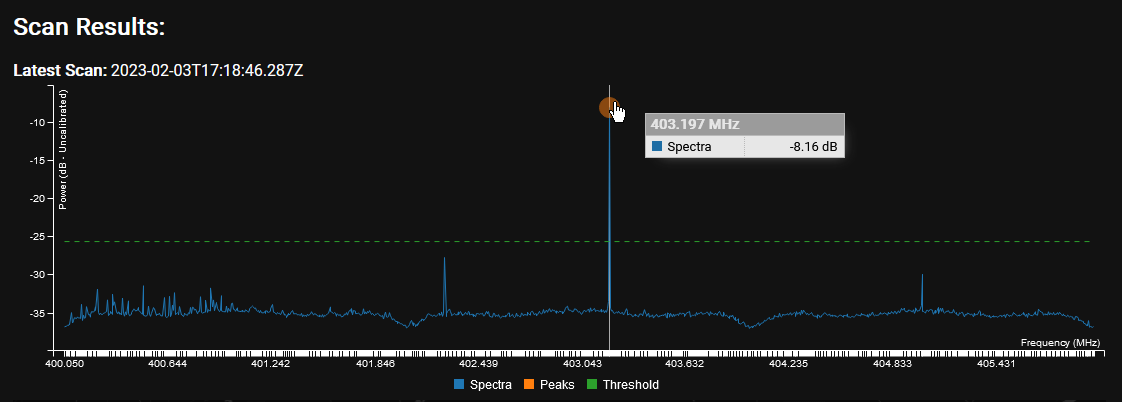
Overall note, there are some small birdies around in each screenshot as a result of my horrible test location.
These spectrums are a sort of ‘worst case’ situation and should only be a guide to picking an SDR for your station/location.
Also do note that center (and twin subs) will move a bit at your location due to computer, voltage, USB etc variations. They generally don’t move once the SDR is in and warmed up, but they will be slightly different from SDR to SDR of the same type.
Coax
Coax type is slightly critical at 400Mhz. Mostly it comes down the length required to go from the antenna to the SDR. (Personal rant here, please don’t fall into the common trap of thinking less coax length and long USB cable is better - its not. Sure a few feet of USB extension to get the SDR away from the RF noisy computer is ok and often a good thing, but a long USB cable is always a poor substitute for good quality coax).
Many use good quality 75 Ohm tv coax for shorter runs (Say, 50 ft or less). You can ‘get away’ with this slight variation in impedance since the SDR is not 50 Ohm input and we are not transmitting.
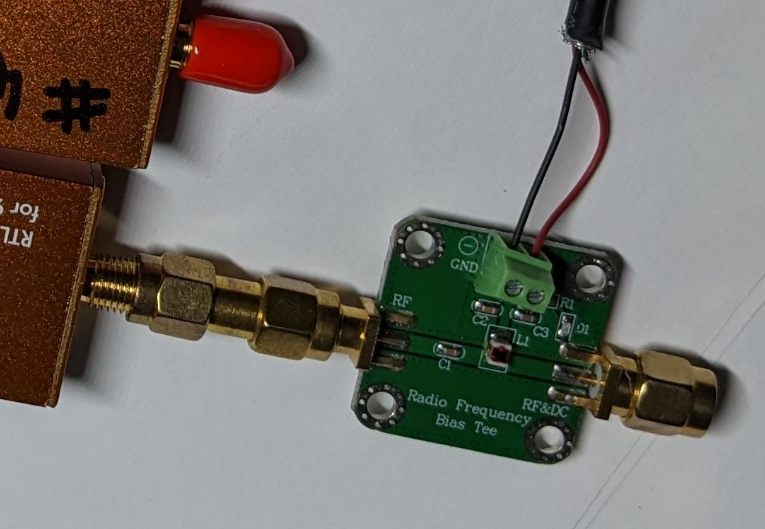
LNA - Low Noise Amplifier
LNA. There is no question that a good quality LNA mounted at the antenna will make a huge difference in the range and amount of data packets you decode from any given flight.
While you could use a general wide band LNA that are very cheap and popular, a filtered LNA will always bring better results.
Uptronics SAW + LNA Here is a PDF with some details on this LNA.
What will you see?
Ok, now that we have an outdoor antenna mounted up as high as you can, quality LNA, good coax and your SDR connected to the software, we wait.
The twice a day launches usually happen around zero and 1200 UTC. But at times of unusual weather or if you live near a rocket launch site, you may catch many more flights at any time of the day or night.
Jan 2023 we had some nasty weather in California and my station logged the following flights over 24 hours.
station.conf file tweaks
We will now review the auto_rx station.conf file. I use nano to edit mine, you can use what ever your comfortable in.
The first thing to consider is the gain settings.
Most people run AGC or -1. These are the valid RTL gain values:
# SDR Gain Setting
0.0 0.9 1.4 2.7 3.7 7.7 8.7 12.5 14.4 15.7 16.6 19.7 20.7 22.9 25.4 28.0 29.7 32.8 33.8 36.4 37.2 38.6 40.2 42.1 43.4 43.9 44.5 48.0 49.6
I usually copy these into the file at the gain setting area to keep them handy.
Be sure and set bias = True if you need your SDR to power the LNA. Be sure and use an SDR that has a Bias-T output and is powerful enough to drive the LNA. (Side note, my distaste for software/dongle Bias-T is famous. Spend the few bucks and get a physical Bias-T injector and save your self so much stress and lost time by using something that is physical, has a power LED on it and will deliver the current required by the LNA at 5vdc (not the usual 4.3v from the dongle)).
One of the best ways I have found to find the best gain for your setup is to plug the dongle into a laptop and run some SDR software to see the sonde signal during a flight and then just adjust the gain for the best signal to noise and make a note of the that gain value and then put it in the station.conf file and restart auto_rx. (ie, raise the gain till the noise floor just starts to rise and the signal does not get any bigger)
This can be tricky if you don’t have a laptop and are running a headless Pi.
In this case, careful notes and some experimentation over time will be required. More tools to help with this process further down the page.
Next up in the .conf file is the sonde frequency settings.
Be sure and look at the notes in the file and set your min and max frequencies to follow the advice in this comment section of the file.
Next up is the only/never/always scan section.
Since I see some common spikes in my area that never seem to go away unless I disconnect the antenna I have added those to the never_scan section, but before you do that, I suggest you make careful note for a few weeks of all the sonde frequencies in use in your area to make sure you don’t accidentally add one of those to the never_scan list.
The list should be comma separated, something like this (don’t use these!):
never_scan = [403.2,403.06,405.76,401.92,404.97]
If you don’t have more than about 5-8 constant spikes, there is probably no need to record them and lock them out.
Tip, use the left side top menu from auto_rx while its scanning and take a note of the peaks it finds. Track them for about an hour in a text document and you will know what peaks are in your area and the ones you might like to put on the never_scan list.
Next is station location.
Its very important to fill out this section, but as it says in the comments, it does not have to be super accurate.
A nearby cross road is fine. I find the alt to be important and helpful to be accurate. It should be in meters and include your antenna hight.
The section ‘Uploader Antenna Description’ will be what shows up on your station on sondehub website, so make it friendly and helpful.
Thats the critical sections that need to be tweaked.
I find the email notifications helpful and enjoy them, note you should use a throw away or ‘computer only’ email address here, not your main one and you should be using two factor authentication with an application specific password in this section. Lots of guides on the Internet on how to set that up.
(If I get time I will show how I use Telegram via Node-RED for my launch notifications).
Single SDR Operation
auto_rx will now start scanning the frequency range you have specified and any peaks found will be analyzed for a short time to see if they contain any of its known sonde type modulated data. If so, the first data packets it finds it will stop the scanning process and just listen to that one frequency to decode the data from the sonde.
It will camp on that frequency till the sonde signal drops below your noise floor for 180 seconds (adjustable and we will talk about that timeout value in a moment).
Once the 180 second timer is up, the SDR will go back into scan mode.
Over the space of a few weeks while you get the feel for the flight patterns you will find if you have the chance to hear more than one sonde at a time.
If so, its time for…..
More SDRs. More simultaneous sonde flight decodes
If you are lucky enough to live in an area that see’s perhaps a few sondes a day at the same time, you might like to add more SDR’s to your setup.
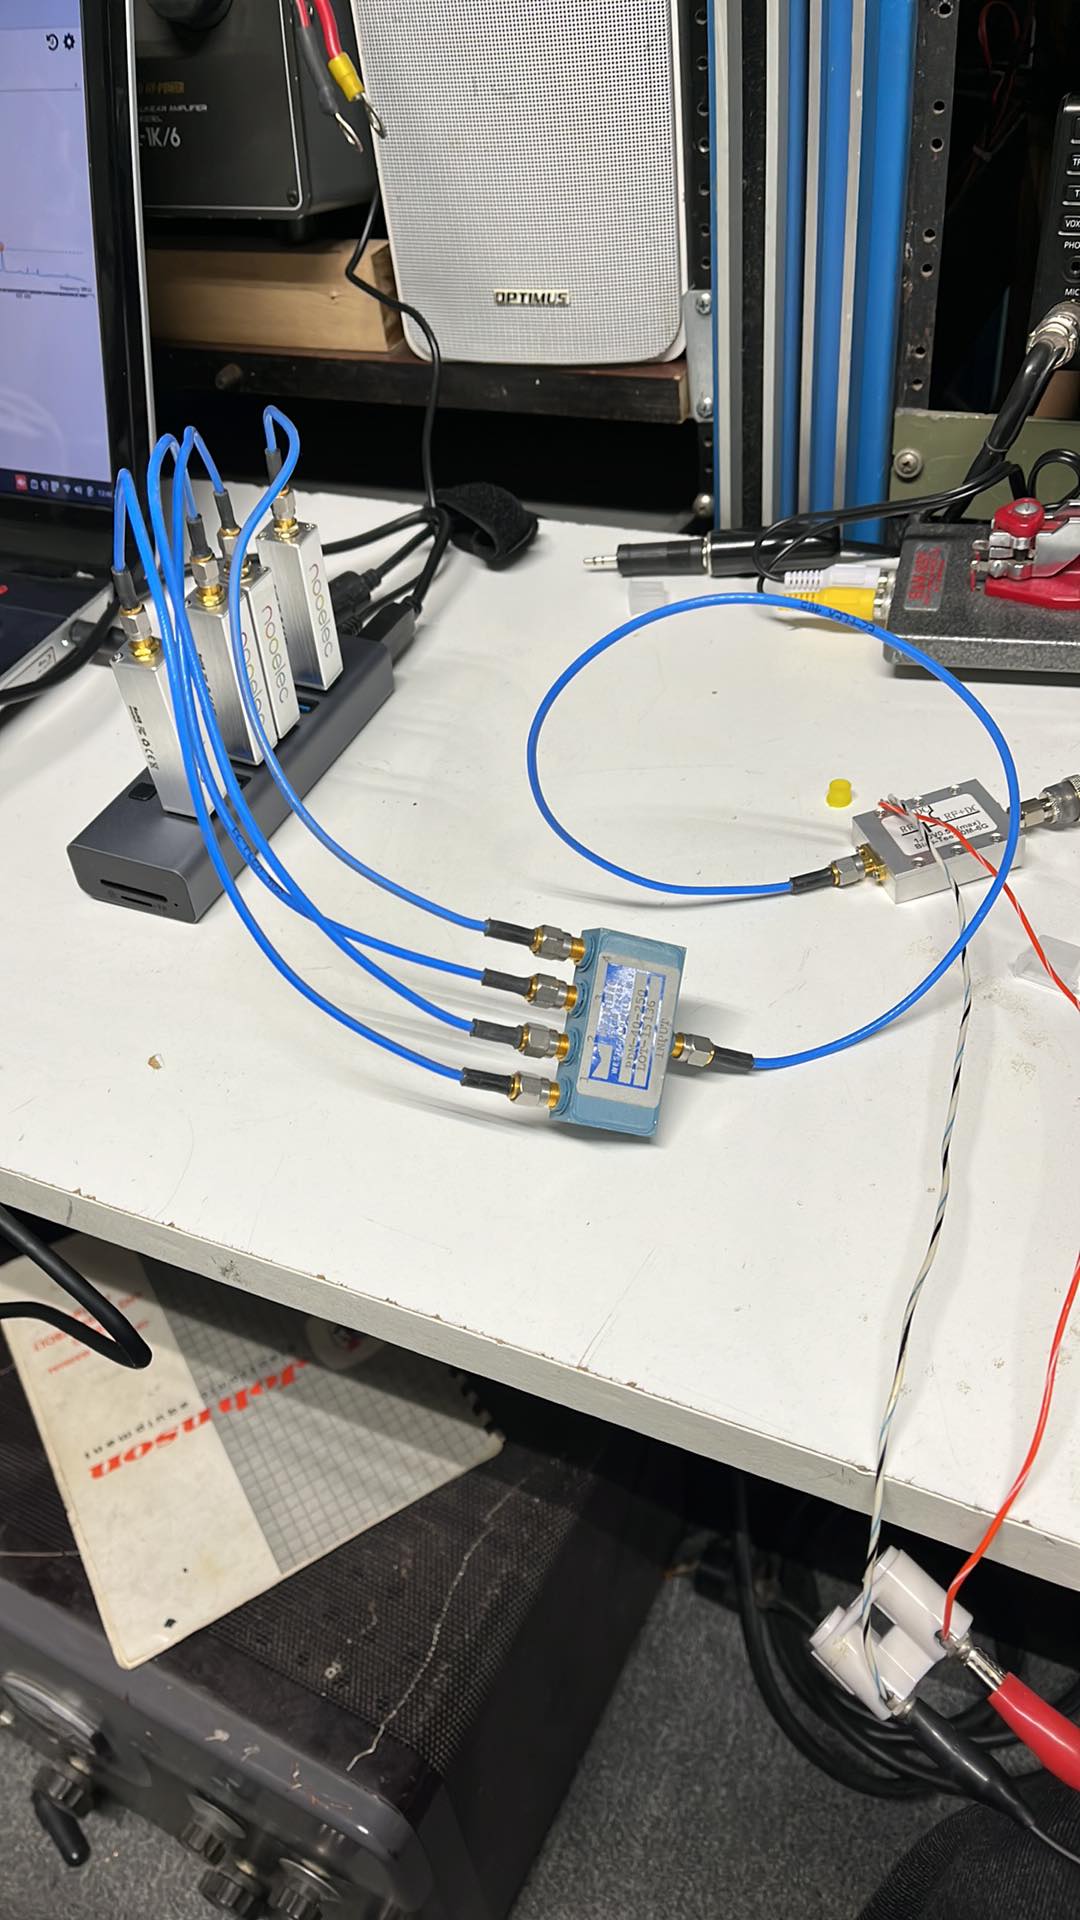
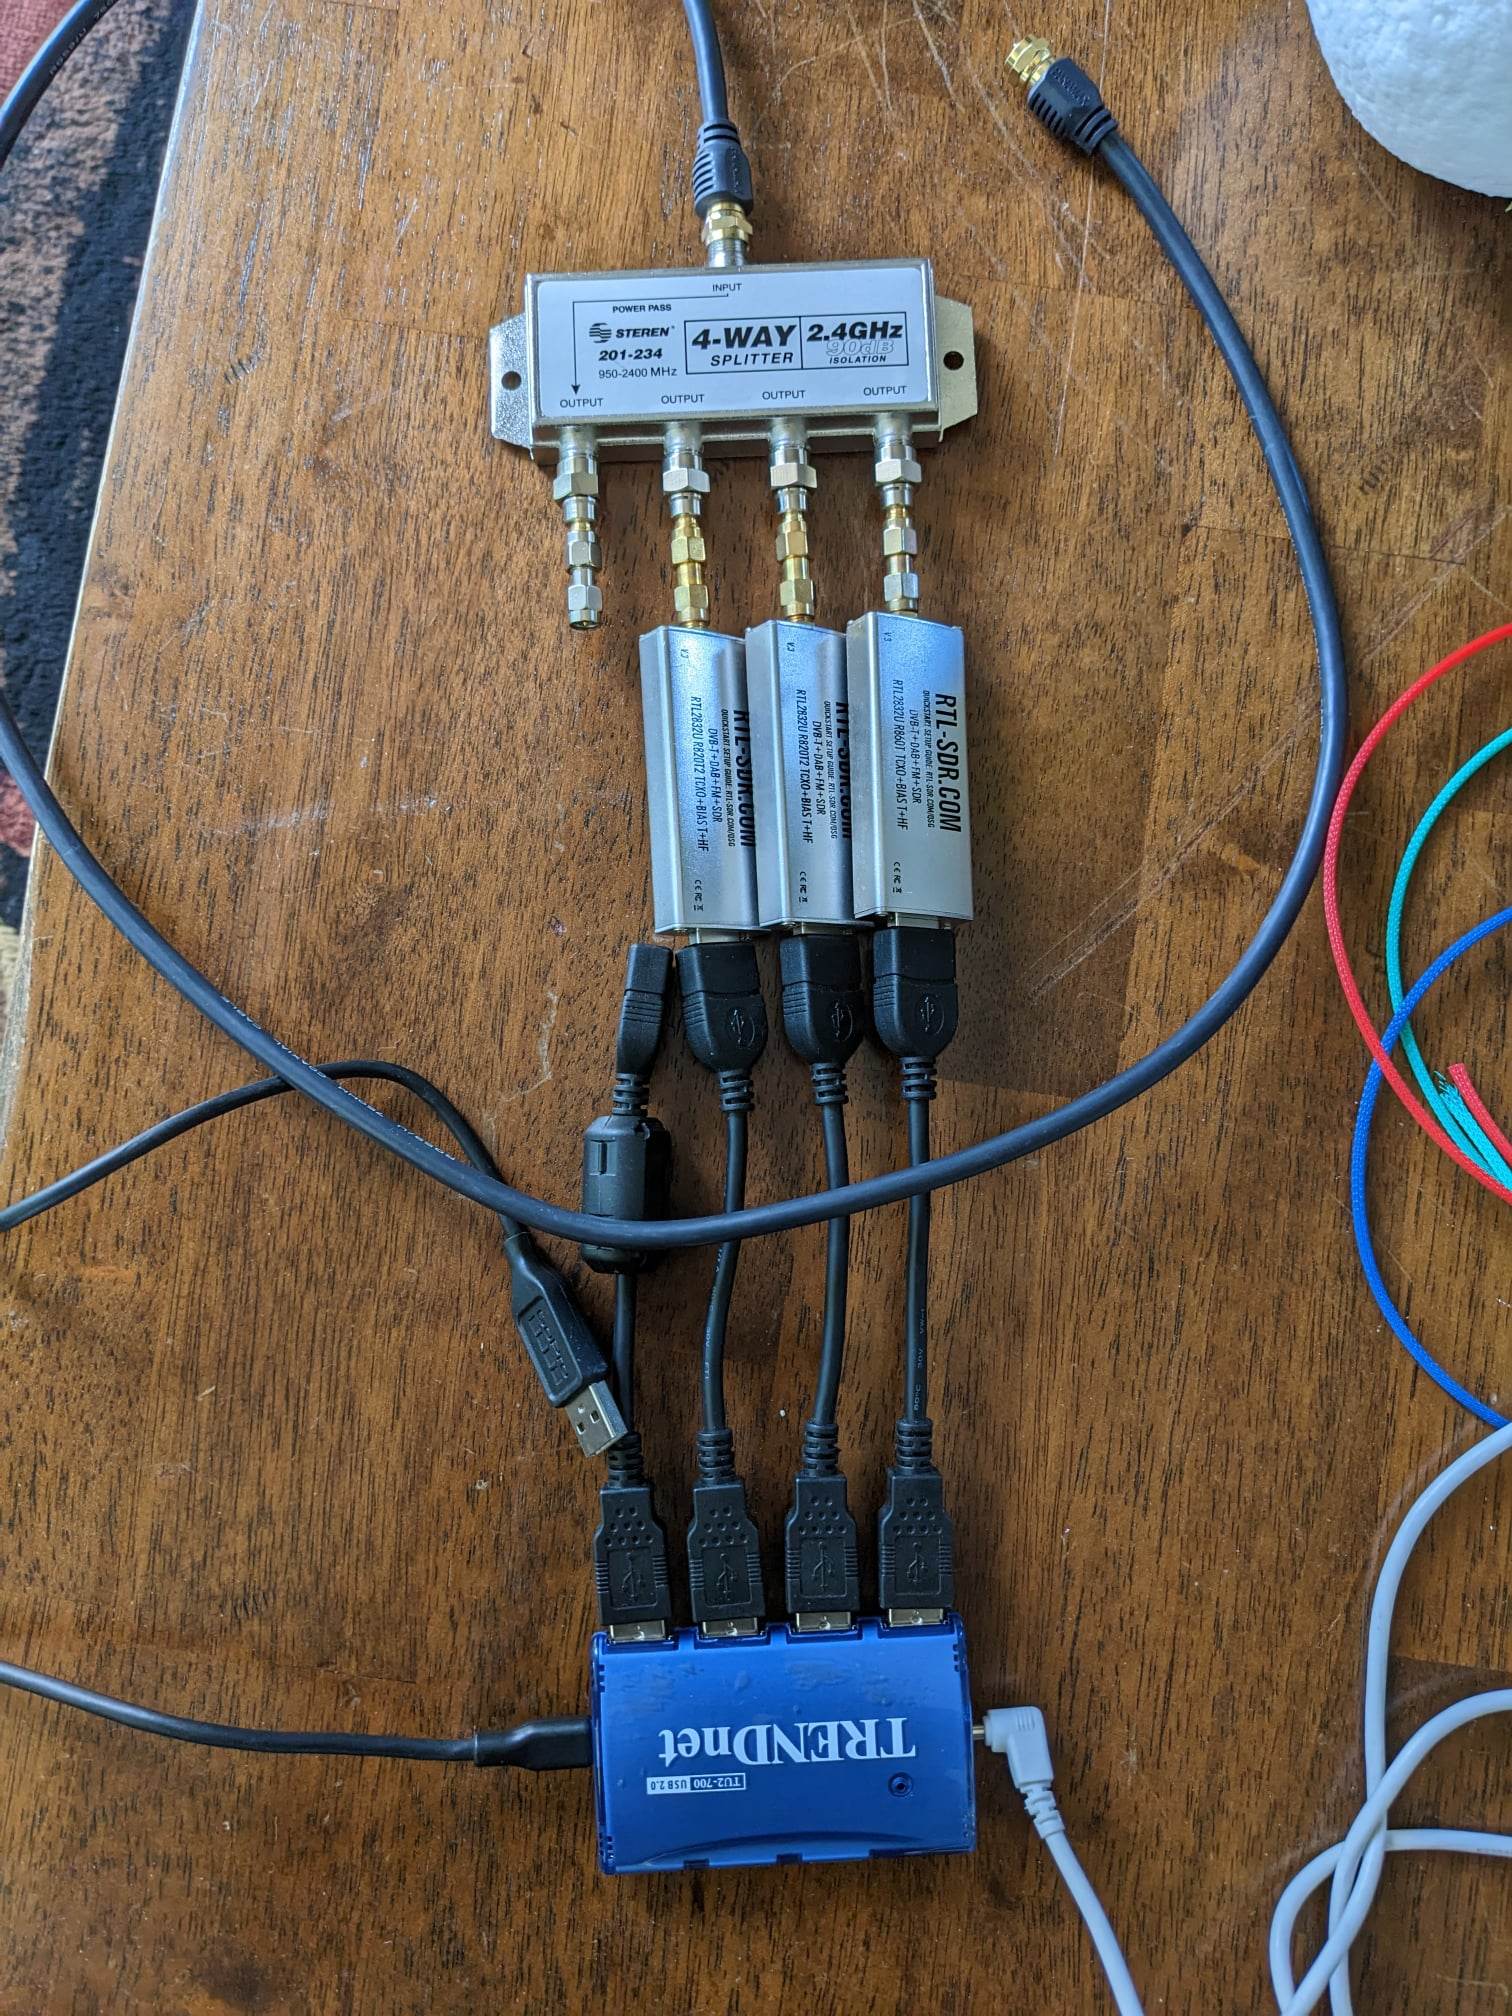
You can go with 2 or more SDR’s. As many as you have signal strength to drive through the 3db to 6db of loss that the splitter introduces.
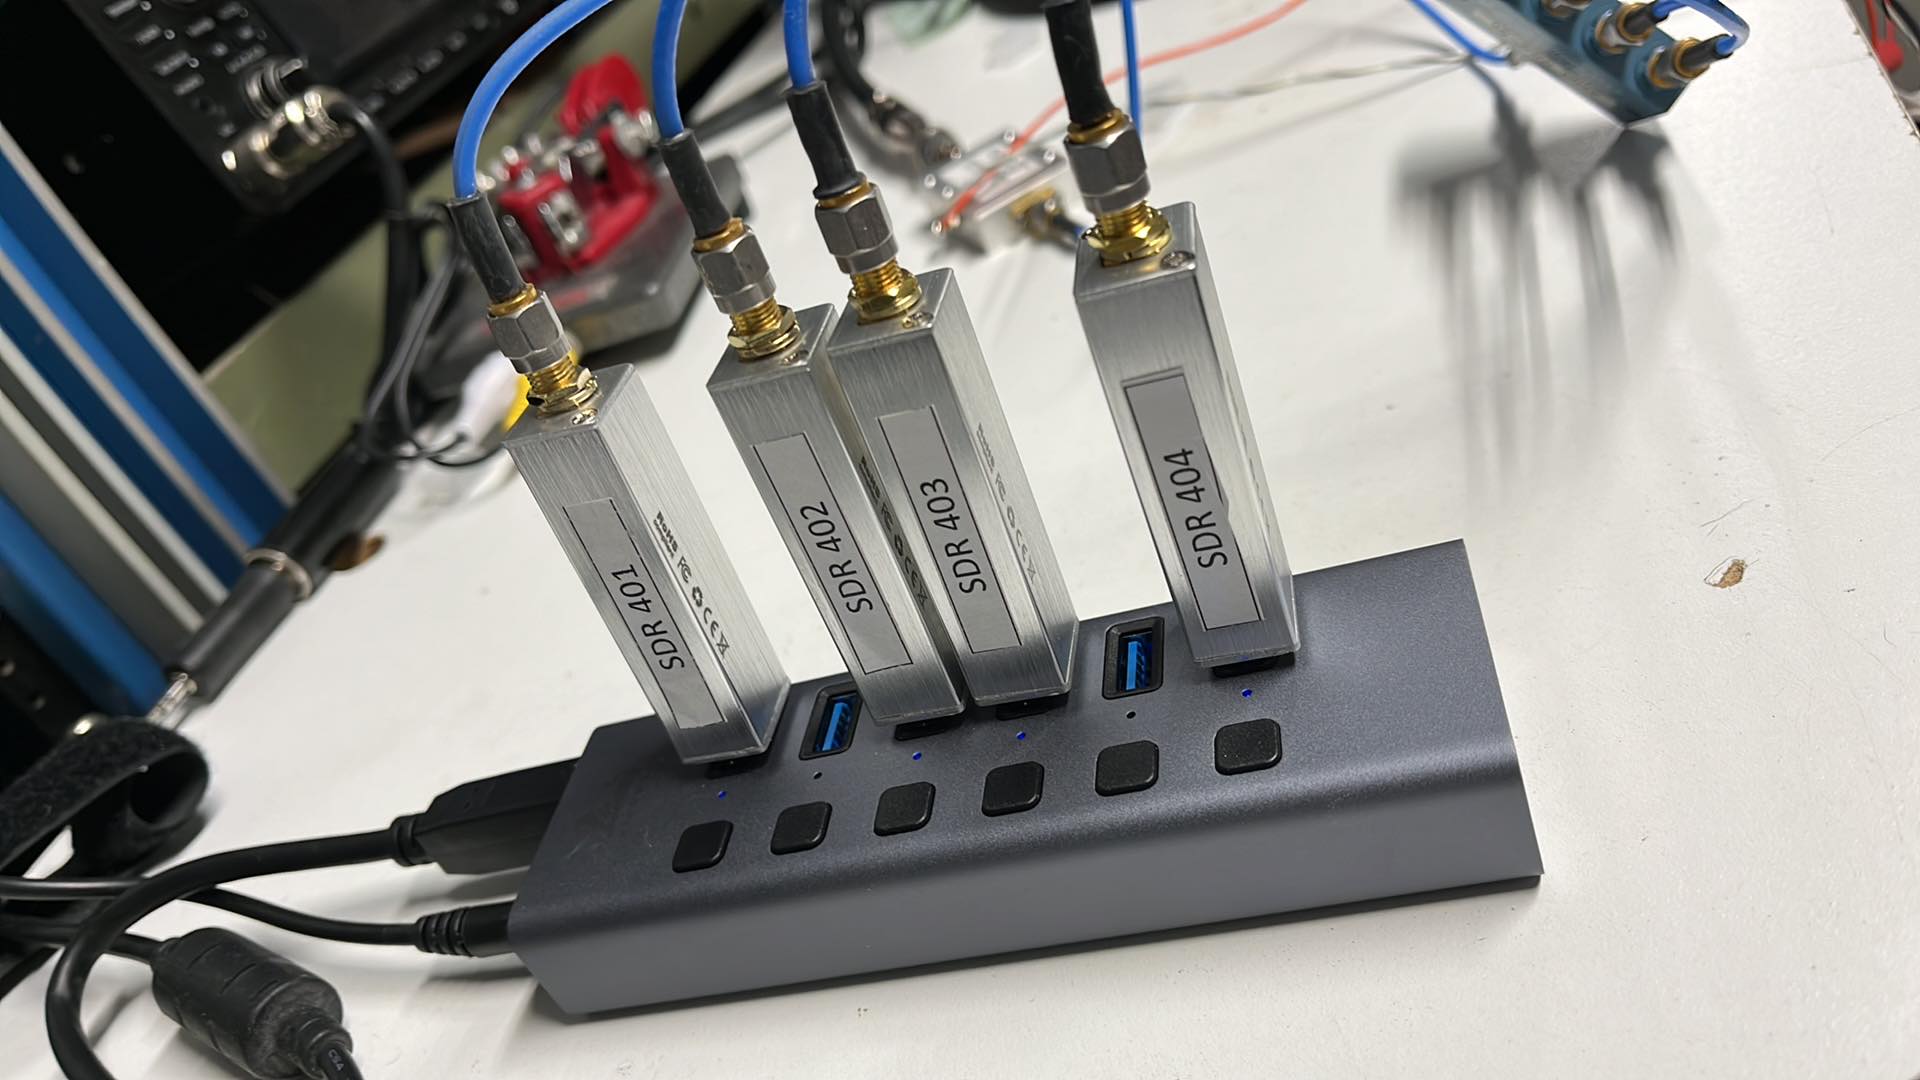
A critical aspect of running more than one SDR is to set each SDRs serial number. Here is how to do that…..
First, stop auto_rx from running. (how you do this will depend on how you installed it and are running it).
Unplug all your SDRs but one.
Now, from the Linux command prompt, enter: rtl_test and see if your computer sees just the one SDR plugged in and that its not in use.
Hit CTRL + C to stop that running.
Now enter rtl_eeprom -s 401 and hit enter.
Answer Y and see that your new serial number as been applied by running rtl_test again and checking the new SN#.
Hit CTRL + C to top that running.
So we chose 401 for 400Mhz and 1 because the SDR’s are numbered 1,2,3,4 etc in auto_rx.
Unplug that SDR and mark it clearly with ‘401’ and plug in the next SDR.
Now, from the Linux command prompt, enter: rtl_test and see if your computer sees just the one SDR plugged in and that its not in use.
Hit CTRL + C to stop that running.
Now enter rtl_eeprom -s 402 and hit enter.
Answer Y and see that your new serial number as been applied by running rtl_test again and checking the SN#.
Hit CTRL + C to top that running.
Set that SDR aside and mark it ‘402’ clearly.
You get the flow now, so do the next two SDR’s and make them ‘403’ and ‘404’.
Ok, now plug all 4 into your powered USB hub and plug it into the computer and issue the command rtl_test and make sure all 4 show up. (Yes, if you know what you are doing you can plug in all 4 and use the -d option to specify the SDR device number rtl_eeprom -d x -s yyy where x is the device number from the rtl_test command and y is the serial number you want for that device).
BTW, we are running all 4 in a powered USB2.0 hub in a Raspberry Pi 4 and have no issues with all 4 decoding at the same time. The CPU use goes up of course, but there is no problem decoding that many on a Pi4 or better.
We are almost ready to go….
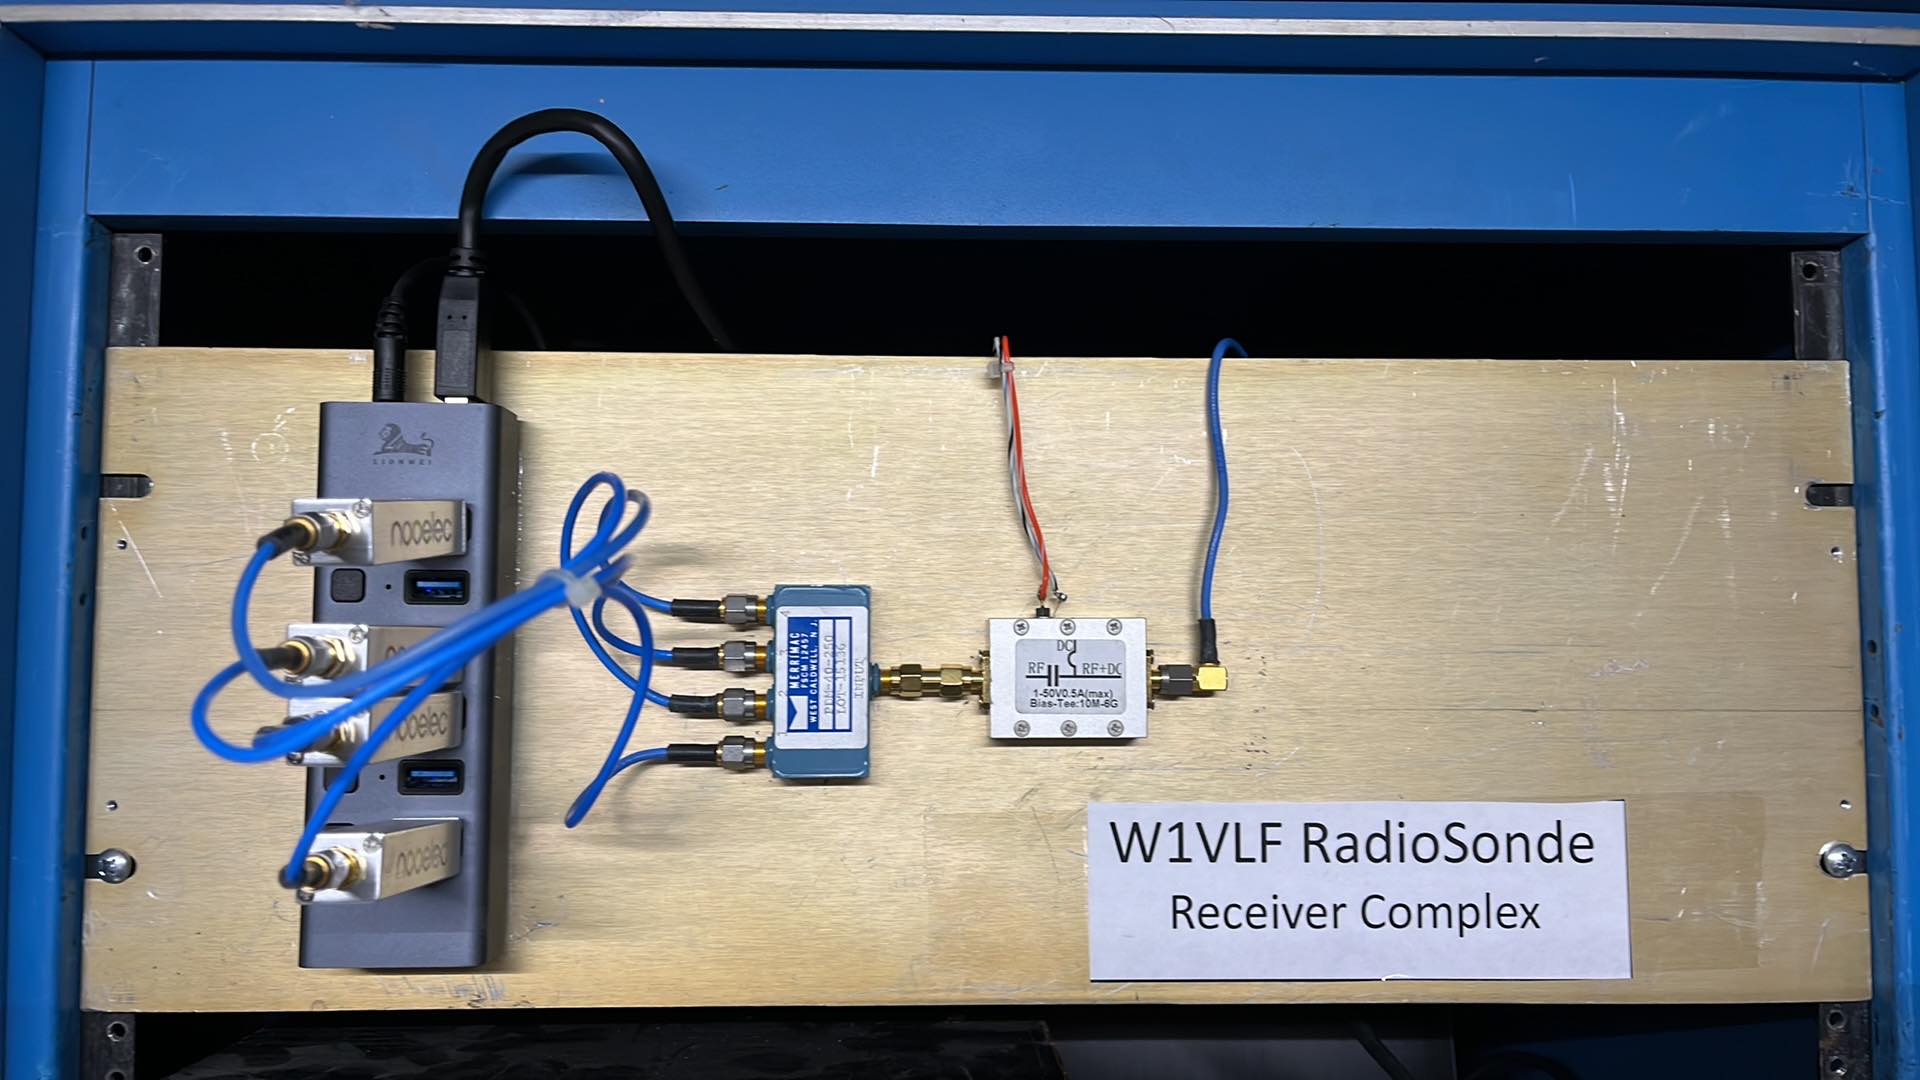
If you insist on running dongle Bias-T make a note which port on your splitter has the power pass.

Note how in this photo of my splitter it is the port on the very left. What ever SDR Sn you put on that port you will need to ensure that one has the bias-t turned on to run your LNA. Note which serial number you put in there so you can set the bias = True command in the station.conf file with the correct SDR. (I only mention this because people like pain and suffering and will insist on using the software bias-t and bring all the problems with that setup - if you use a physical Bias-T injector, you don’t need a splitter with a power pass port. Have I mentioned how many times trying to use the dongle bias-T has caused issues?).
You will now need to change your station.conf file to account for the number of SDRs you are running.
My 4 SDR station .conf looks like this:
[sdr_1]
device_idx = 401
ppm = 0
# SDR allowed gain settings
# 0.0 0.9 1.4 2.7 3.7 7.7 8.7 12.5 14.4 15.7 16.6 19.7 20.7 22.9 25.4 28.0 29.7 32.8 33.8 36.4 37.2 38.6 40.2 42.1 43.4 43.9 44.5 48.0 49.6
#gain = -1
gain = 40.2
bias = False

[sdr_2]
# As above, for the next SDR, if used. Note the warning about serial numbers.
device_idx = 402
ppm = 0
#gain = -1
gain = 40.2
bias = False

[sdr_3]
# As above, for the next SDR, if used. Note the warning about serial numbers.
device_idx = 403
ppm = 0
#gain = -1
gain = 40.2
bias = False

[sdr_4]
# As above, for the next SDR, if used. Note the warning about serial numbers.
device_idx = 404
ppm = 0
#gain = -1
gain = 40.2
bias = False
Note I put the AGC on comment so I can test either gain setting pretty quick. I simply have to stop auto_rx, swap the # comment around and restart auto_rx, I can do this several times in a sonde flight to quickly test gain changes. Since you never know which SDR will be scanning and which will be decoding, they should all be the same gain value.
I also updated my station antenna description to reflect that Im using 4 SDR’s.
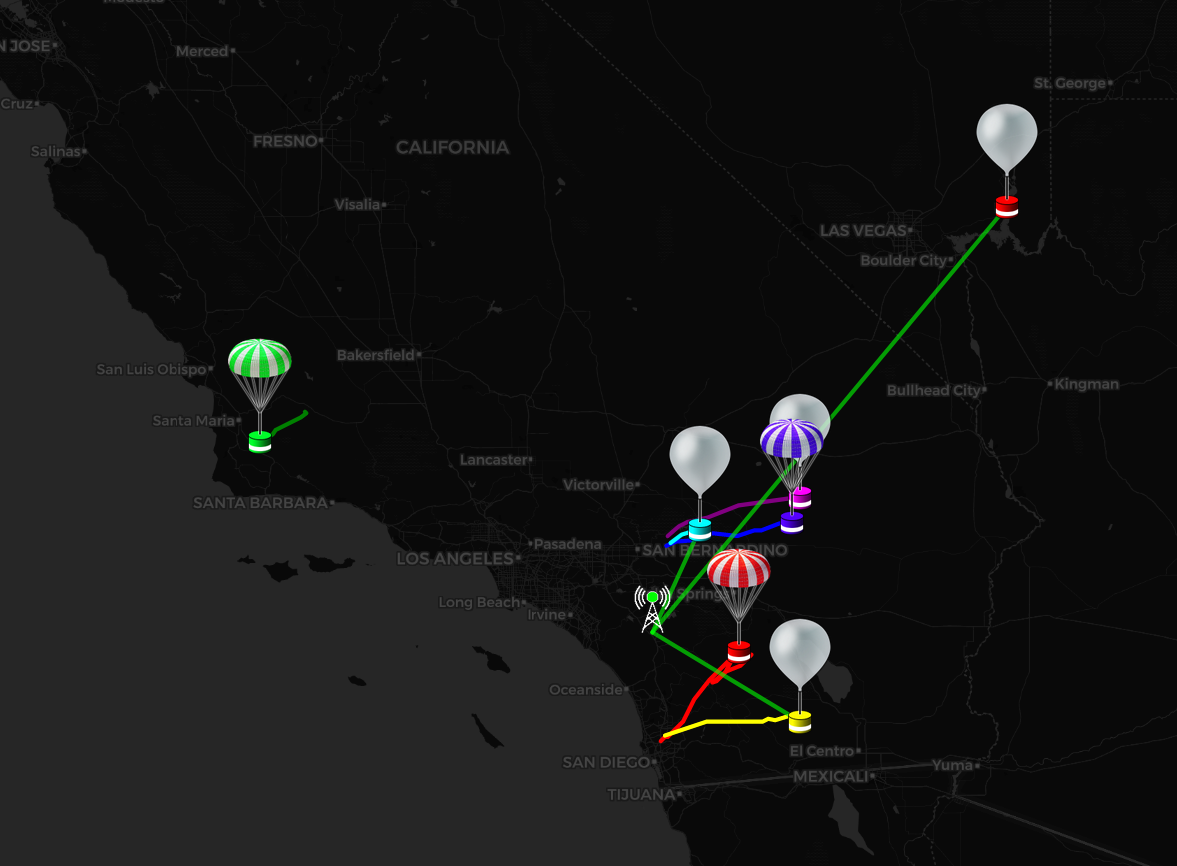
Once you have the SDRs setup in the conf file its just a matter of waiting and before long you will see things like the following two maps… lots of sonde data flowing into your station. East Coast and West Coast stations with 4 SDRs.
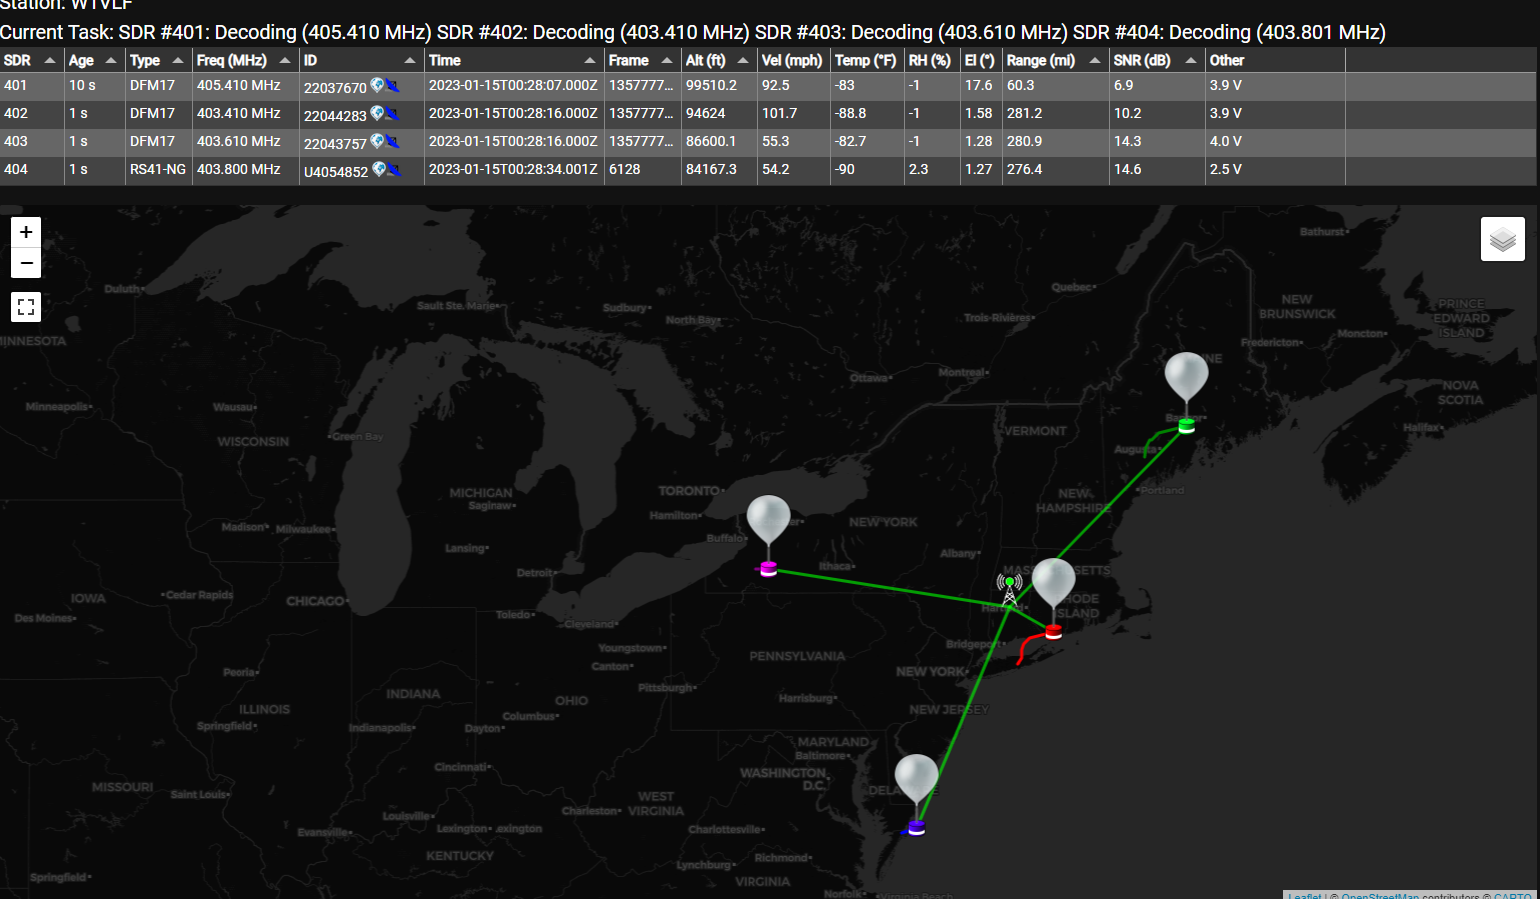
The order of operations for auto_rx now becomes something like this.
The lowest serial number SDR will be scanning. When it finds a peak with sonde data on it, it passes it off to the next highest SN SDR and keeps scanning.
If it finds another sonde it will check if the next highest SN is already decoding, if so, it passes it up to the next highest serial number and goes back to scanning.
If all three are decoding and it finds another sonde to decode, it will stop scanning and start decoding with no more SDR’s left, your station can not scan for a 5th or more sondes till one of the current decoding SDR’s timeouts and it will then become the scanner at that time. So yes, be aware that you can not control exactly which SDR will be the ‘scanner’ SDR at any given time. Thats the main reason I find it ‘important’ to use 4 SDRs of the same type and gain setting.
The ‘lost signal’ timeout is adjustable in the station.conf file just under the min and max frequency setting section. It looks like this;
rx_timeout = 900
Its default is 180 seconds, you can see I have bumped it up since I have 4 SDRs I can afford to keep listening to each sonde longer before giving up and going back in the ‘not tasked’ pool and wait for the ‘scanning’ SDR to hand it a sonde to decode.
This time extension is also helpful for me as there are lot of mountains around my location and the sondes will drop into my noise floor while they go behind a peak and I want to stay on frequency so I can pick up decoding as soon as they float out of the shadow of the mountain peak.
Quantifying station changes
Two of the many challenge’s facing the serious sonde station owner is quantifying how well their station is performing and the time it takes to measure each change.
Since each sonde flight will have slightly or very different distances and altitudes from the antenna it can be tough to mentally average all those flights out and see if a gain or antenna change really is helping or hindering.
To this end a few guys from the North America Radiosonde Facebook group got together off-group and started talking about how to measure and normalize the data from the many flights over a week or month and visualize that data in a way that would help the station owner ensure their station was running a the very peak it could.
I brought Node-RED to the table and a plan was hatched to use the auto_rx Chasemapper UDP data stream to build some data dashboards.
I want to make it very clear that the small group of RF enthusiasts were hyper focused on NOT reproducing or duplicating any of the existing functionally that already exists in the very awesome auto_rx. For example, there was talk about logging the data to a CSV file, but auto_rx already does that. Same with the distance plot, auto_rx already has a great map that shows the stations max range and typical coverage…. What that plot lacks is the signal strength for those range plots.
Lat/Lon and SNR
The key information in the auto_rx Chasemapper UDP stream is the sondes position and your SDR’s SNR (signal to noise ratio) for each data packet that is received and correctly decoded.
Using this we can tell how far away the sonde is from your antenna and what the elevation the sonde is in relation to your antenna.
The challenge is that the intensity of radio waves over distance obeys the inverse square law, that is to say, the signals intensity is inversely proportional to the square of the distance the sonde is from your antenna.
In short, double the distance and you get four times less signal.
Of course all of this just boils down to a few math problems and math that has been well proven and there are many resources around on the Internet to help get the cold hard numbers out of the data.
How to see the data
Once we have the core numbers: distance, elevation, bearing (azimuth), SNR and normalized SNR for distance we are ready to do something with them.
First up, something that looks like it does the same job (only worse) than sondehub, that is a plot of the sondes weather data.
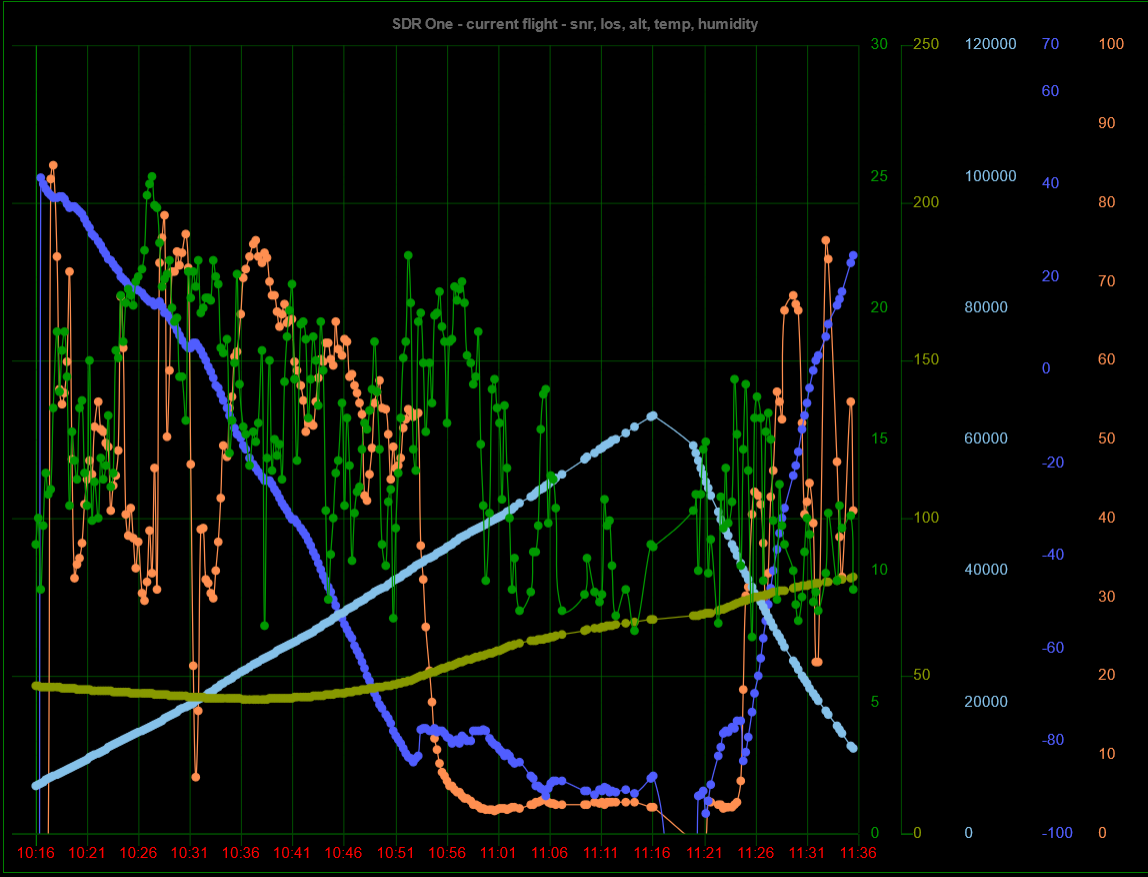
We have altitude in light blue, humidity in orange, distance in yellow and raw SNR in green.
The first thing that will jump out to sonde trackers is the clear slow rise in the blue alt, then the burst and rapid descent. And yes, your quite right, sondehub has this data at the bottom of the main map window, so why do we have it here seemingly duplicating functionally and breaking our ‘dont reproduce’ rule?
Well, simply because the sondehub data is from all the stations hearing that sonde, and thus there are no gaps in the data, unlike what might happen with this graph.
Here the station owner only sees the sonde data their station decoded and if there were any issues then there are gaps in this graph that the owner would not other wise know about. Of course, simply knowing that your station dropped some packets is just the start, now the hunt for why the data drops out flight after flight at the same time/elevation or bearing can be tricky to track down, but is of great interest to those trying to engineer a station to catch all the data it can.
So thats why that graph is on the page, to show any missing data points.
Raw SNR vs Elevation
To the right of that sonde weather data line chart is the raw per flight elevation and SNR scatter plot.
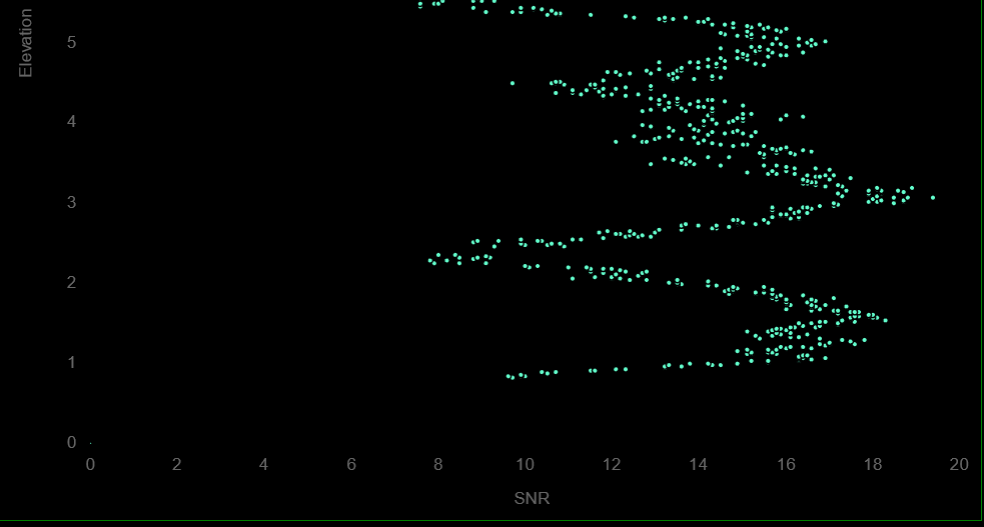
The point of this graph is to better visualize the antenna ‘gain’ profile with the knowledge firmly in mind that you are also going to see any signal obstructions like houses, trees and mountain peaks between the sonde and the station antenna at that elevation and bearing.
That said, over many flights you can start to see how the antenna profile from the scatter plot matches the antenna model:
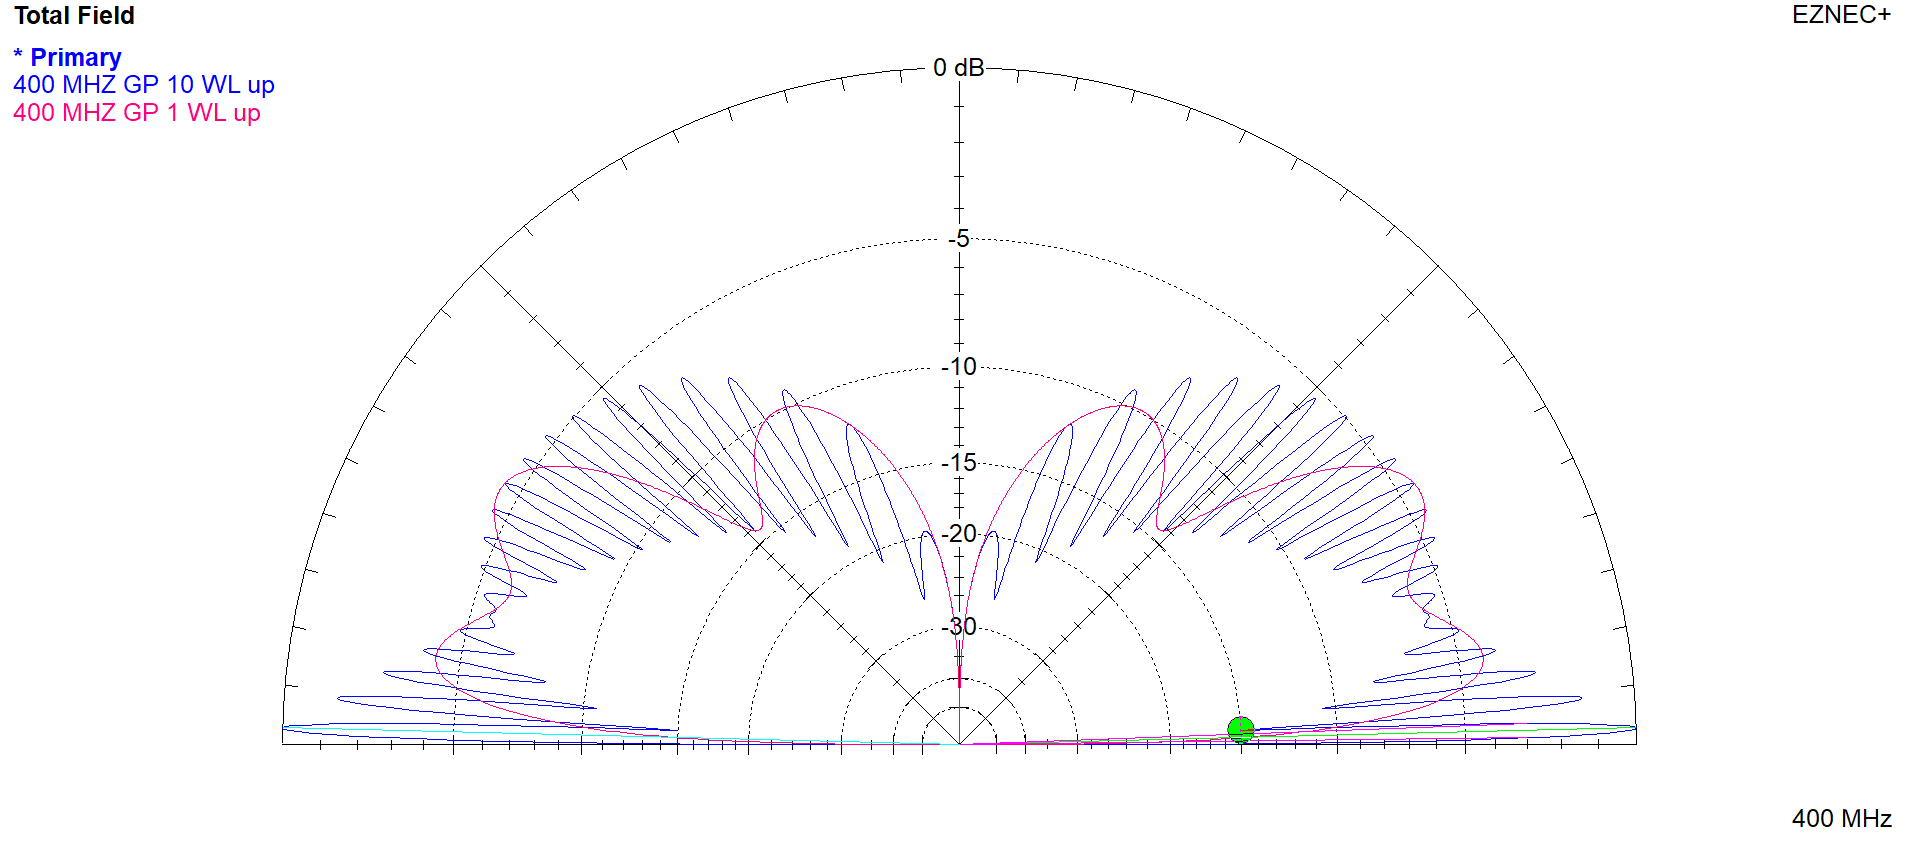
While these screenshots only show one flights elevation and one antenna model so far the results are in line with what we expect to see. ie, they are predictable and understandable plots that are in line with the antenna type and laws of physics.
Its like we are using the sondes as our own full size antenna testing range.
Keep in mind that this scatter plot is per sonde flight and is automatically cleared (reset) as soon as that SDR starts to decode a different sonde serial number.
This scatter plot is not normalized for distance since its the current sonde flight (raw) elevation vs SNR (signal to noise ratio) data.
Main page table, radar and elevation
On the main page we have a few things worth pointing out.
Front and center is a table that contains the past 40 flights. Of course when the software is first loaded, there are no flights and it will take time to fill the table out. Once the 41st flight comes in the top, the bottom flight is pushed out and its gone for ever, there is no logging or storing here.
The purpose of this table is to show a few points of helpful information.
Firstly, if you are running more than 1 SDR, the table shows which one did the decoding for that flight, then the model of the sonde and the frequency that it was transmitting on. This is a critical bit of information that is not in auto_rx log files. You will need this frequency list if you are using the ‘never_scan’ feature of auto_rx.
Next is the SNR, distance, azimuth, elevation and altitude from the first data packets you decoded. This will show, over time, those data points from when your station first acquires the sonde so as you tweak your station you can see if the distance or angle is better (or worse).
Clicking on any of the table column names will sort that column ascending or descending.
At the right hand end of the table is the link to take you to the sondehub URL for that flight.
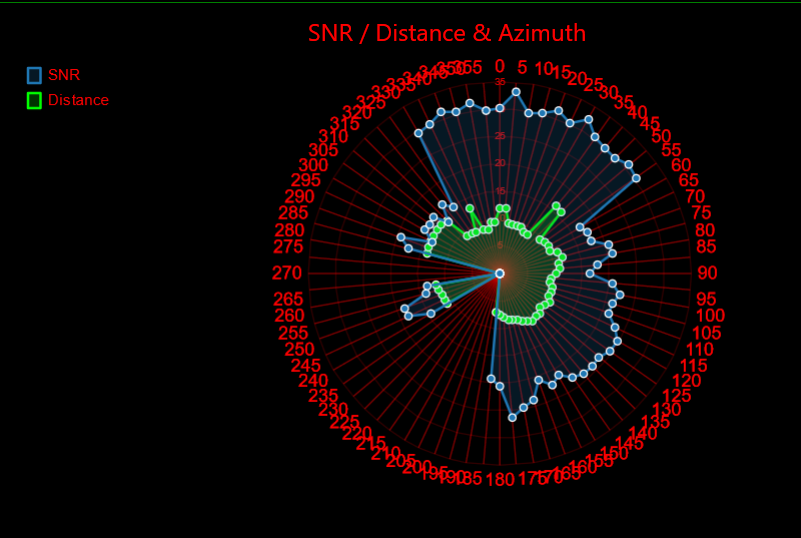
Next, top left is the radar scope. Here you have a top down view with your antenna in the center. Going out from the antenna is distance mapped with bearing to the sonde with 5deg resolution and the normalized SNR for that distance and bearing.
Do note that you can click on the small square title box and toggle that plot on/off.
The purpose of this radar plot is to help the station owner to see their stations distance and what SNR it was for that direction. It will also show any local and distant obstructions, along with typical flight patterns.
Lastly, the elevation scatter plot.
This provides a cross section of your antenna gain/lobes. The difference between this scatter plot and the one on each SDR page is that this one is the master of all the SDR’s over all the flights and is using the inverse square law to normalize the SNR regardless of the sondes distance at each elevation.
What you are looking for here is to ensure your antenna type and mount is giving a nice fat lobe at the elevation that you see the most flights at.
Different antenna types have different vertical lobes and with radiosonde tracking, you want to select and tune your antenna to give its best performance (gain) for the elevation that you see the most sonde flights at.
Terrain
As mentioned a few times, the natural landscape (and man made stuff of course) is going to play a part in how far you can see a sonde in any given direction.
There are two tools that we have found to be very helpful in figuring out if you have an antenna / system issue or a mountain that needs moving….
Heywhatsthat
This is a very common website used in all kinds of radio works. I first found out about it via the ADSB aircraft tracking guys.
Heywhatsthat will show you a 3D profile around a given point, but also of great value is a plot of the range you can ‘see’ from your location.
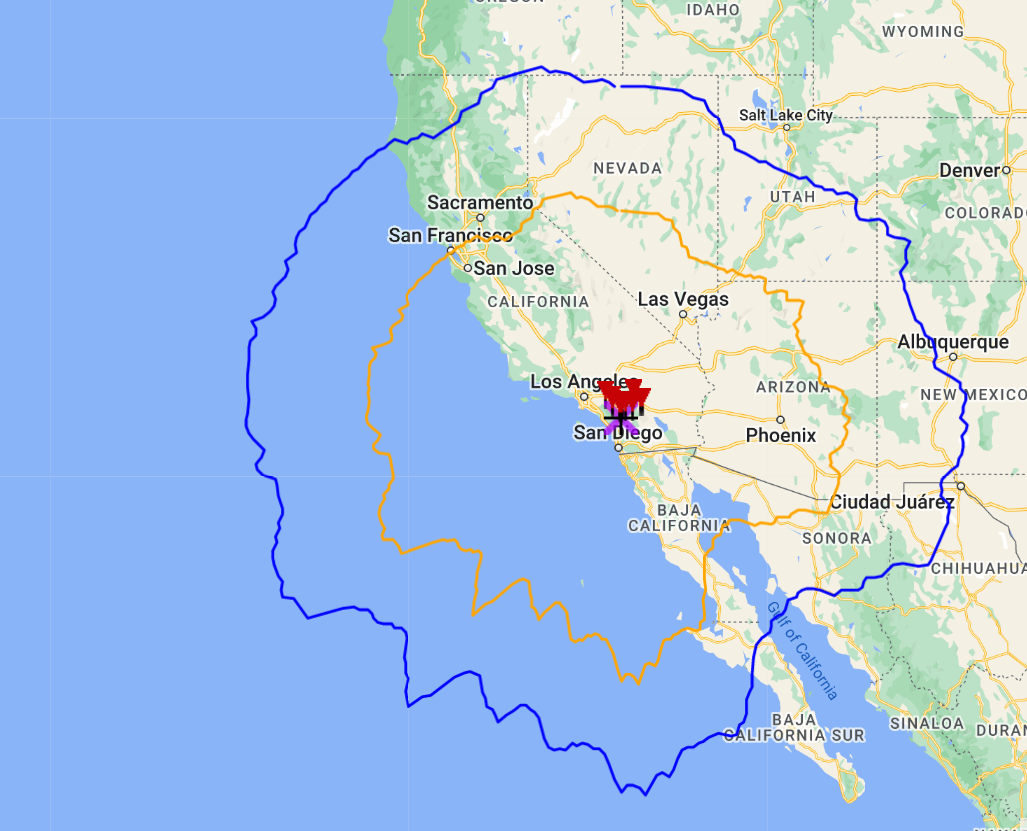
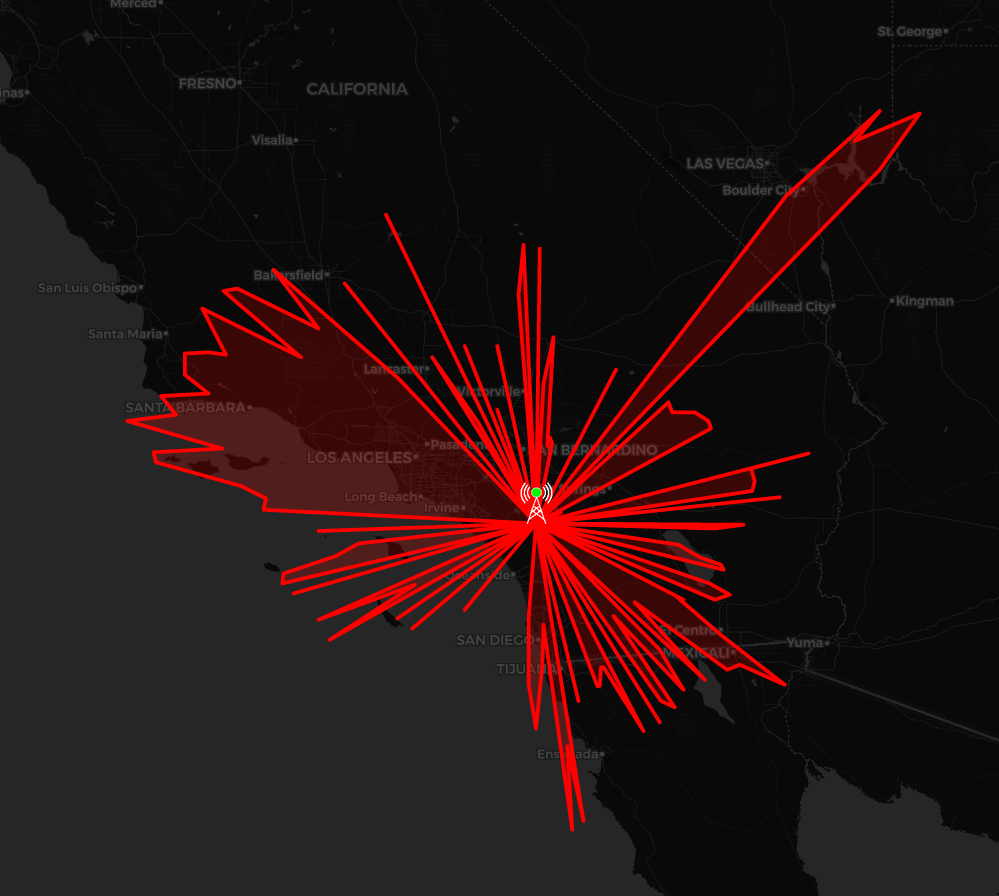
You can tweak the heights via the ‘Up in the air’ option. Here are two plots at 40,000 ft (orange) and 100,000 ft (blue) from our station in Southern California.
You can clearly see the bite out of our coverage to the south east which matches the bite out of the radiosonde_auto_rx coverage plot. Not a lot we can do about it (other than get the antenna lot higher, but alas… HOA… ).
Solwise
This is a UK website (with global maps) that you can use to draw a cross section between your station and a sonde at different hights.
Check out the solwise.co.uk website and make your self a cross section of your trouble bearings like this…

Follow the directions under the map, it clearly shows why I have trouble to my south. The sonde has to be very high to clear that peak before I can get much signal.
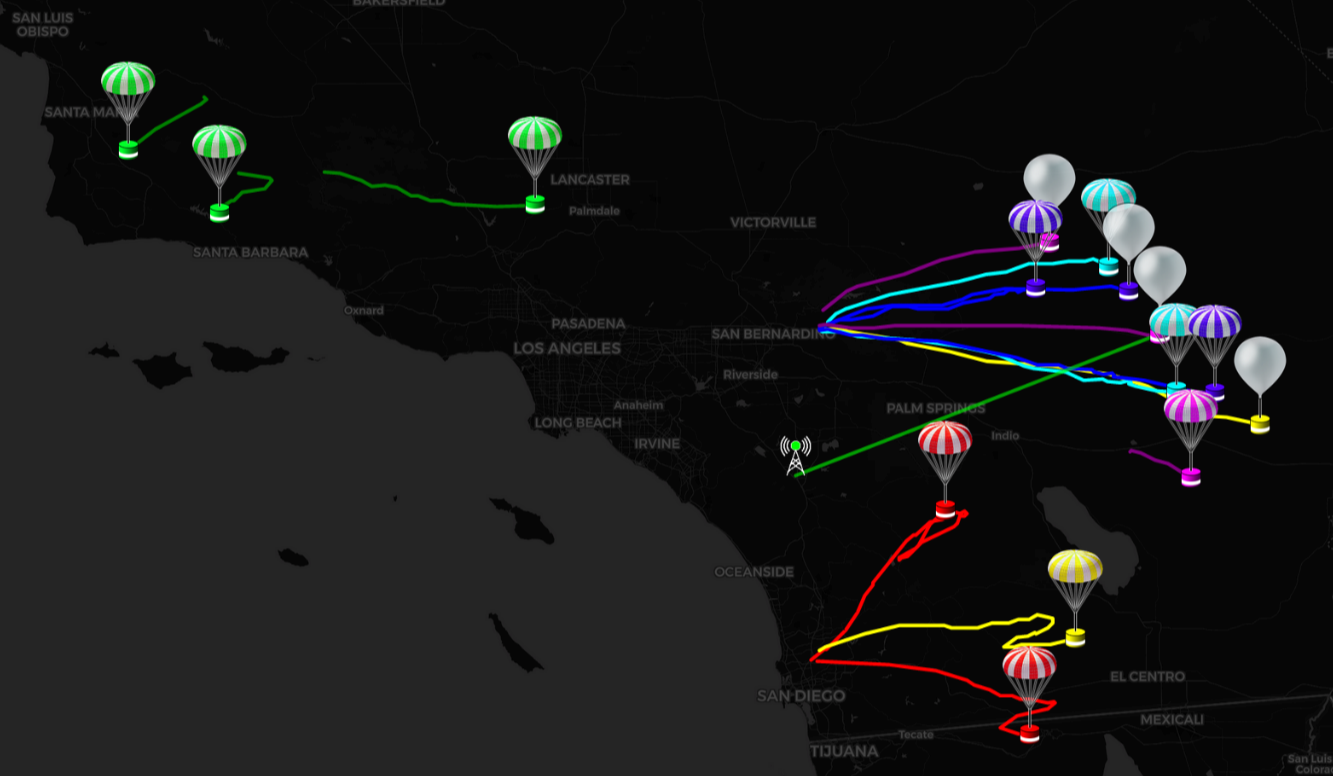
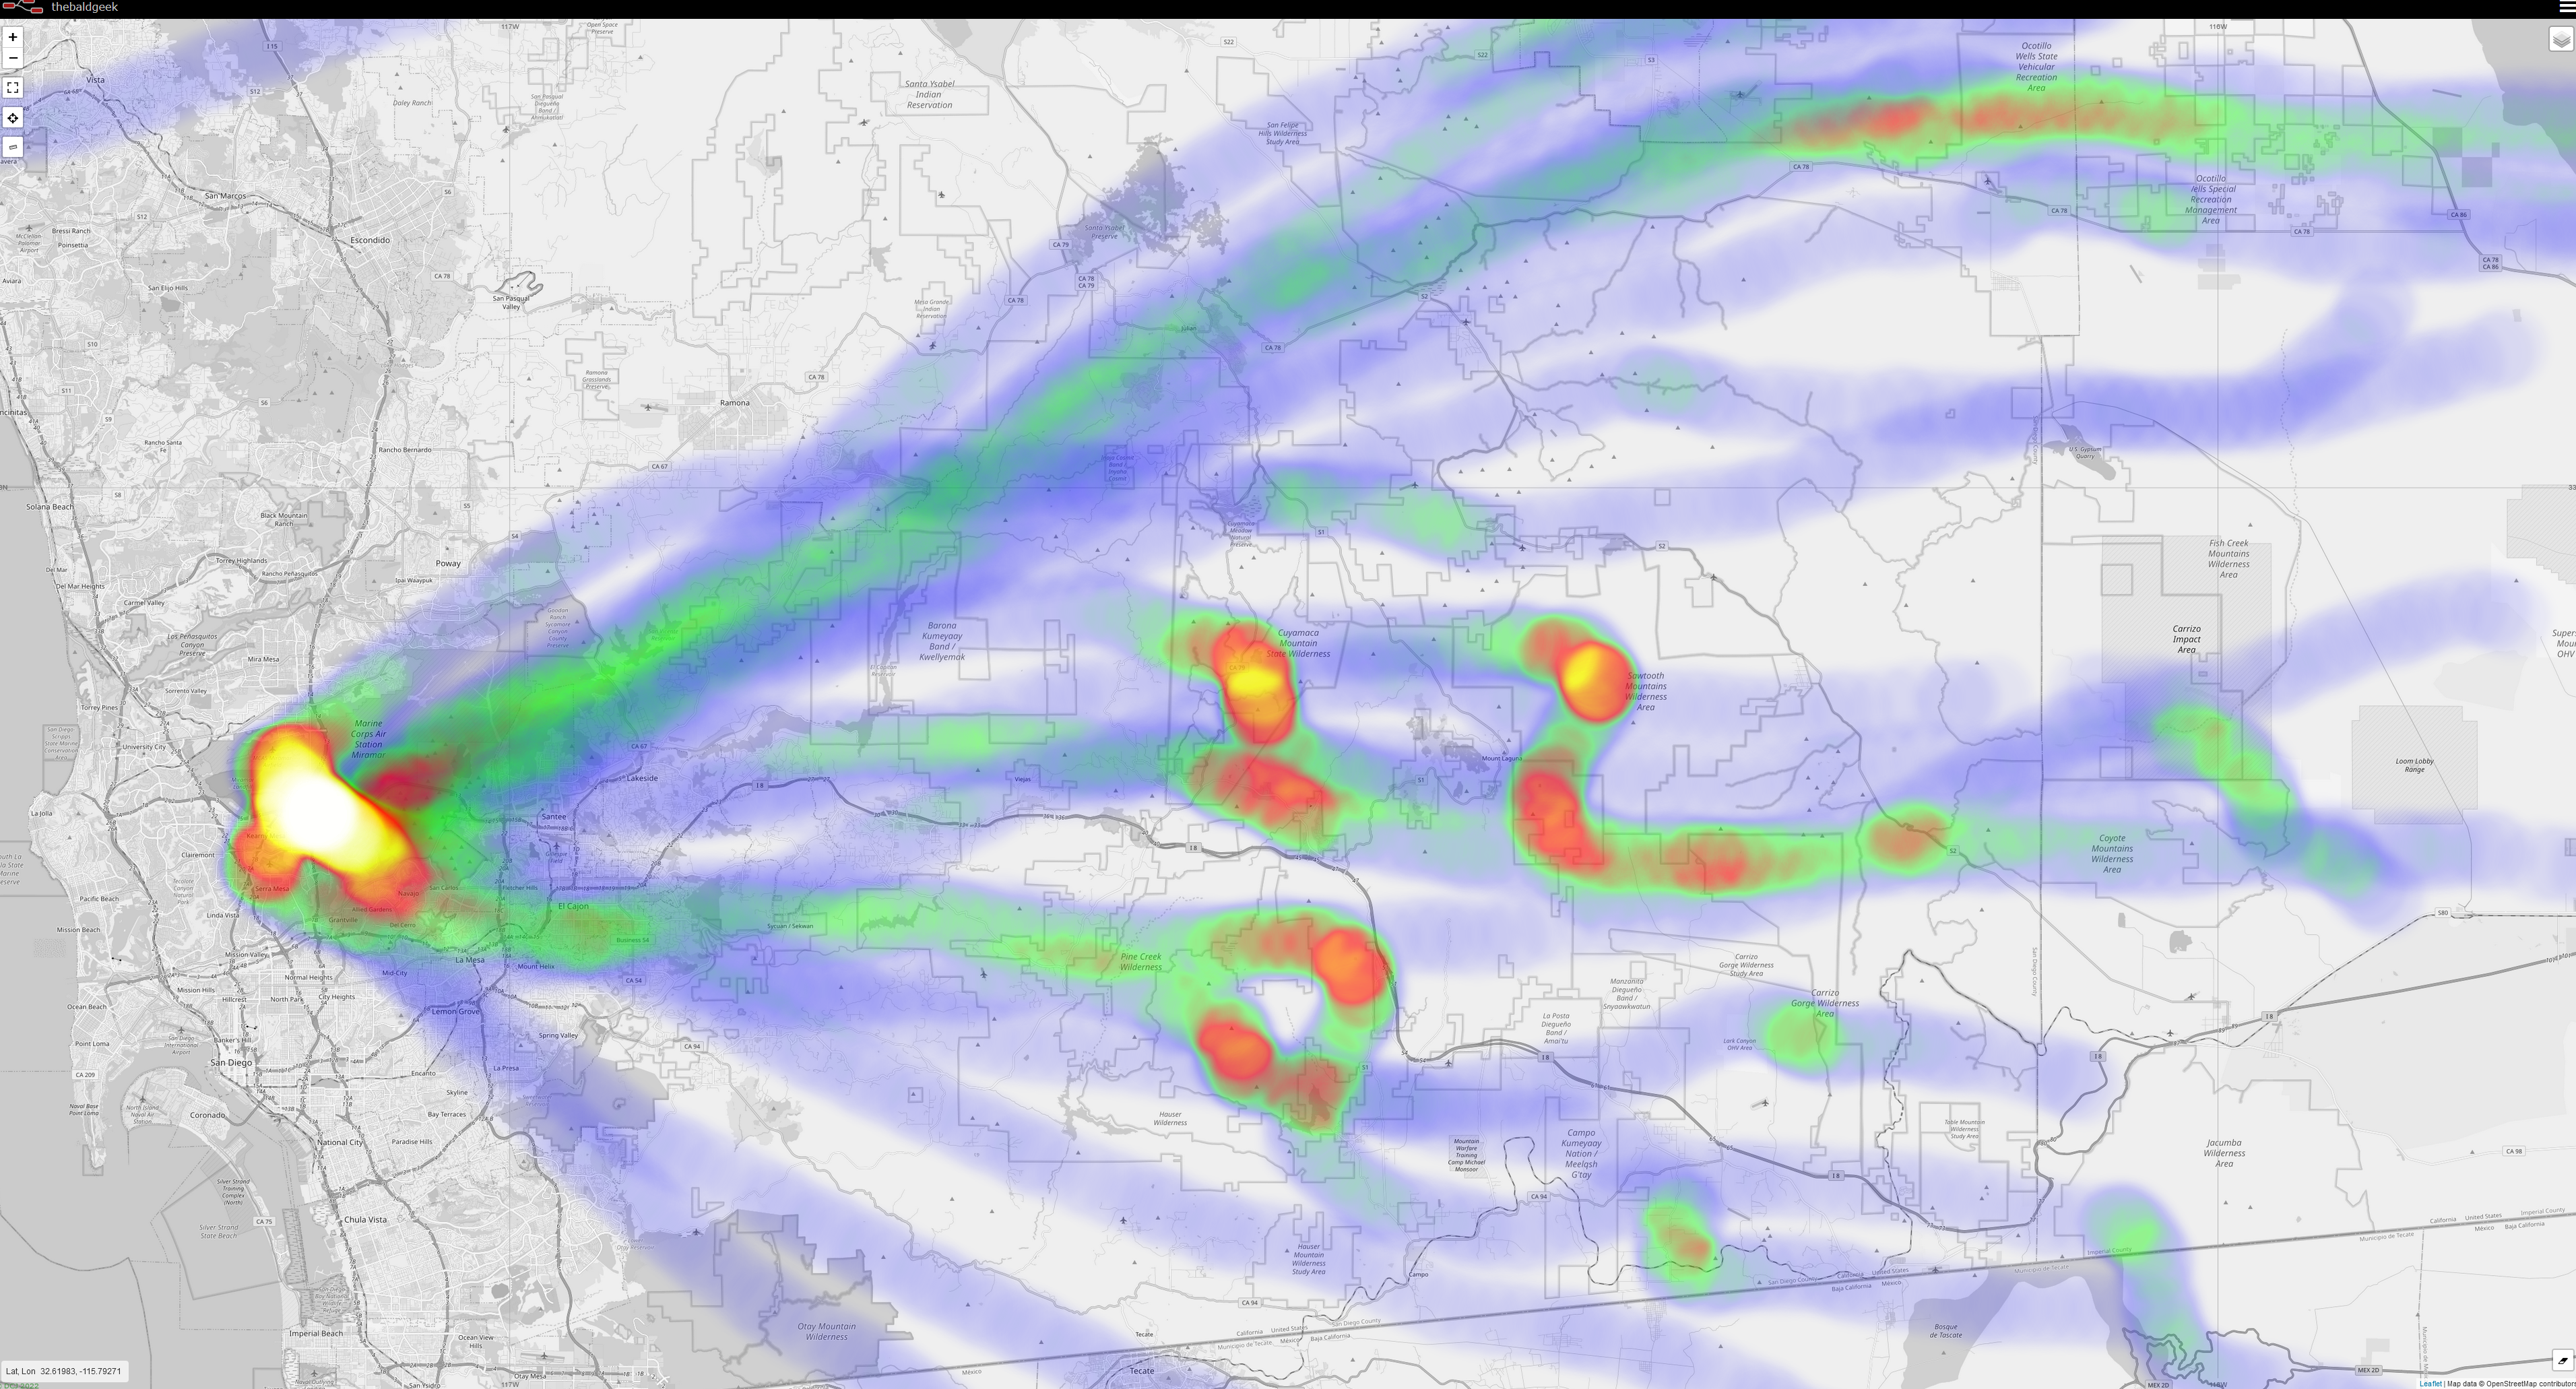
Heat Map
Not included in the instructions bellow, but just so you know…. Node-RED has a great map plotting node called worldmap
If you import this node and tweak the flow a little you can plot the sonde flights that your station picks up. We did not include it as it duplicates a lot of functionality that sondehub and auto_rx include with one exception…..
Worldmap can create heat maps like this:
Installing Node-RED
To run the software you will need to install Node-RED.
Also note that the dashboards only work with the auto_rx Chasemapper UDP output. It will not work with any of the other sonde software packages.
You do not have to install Node-RED on the same computer as radiosonde_auto_rx, it can be run on any computer that is on the same network as auto_rx. Do note that the Node-RED program has to be running all the time to catch data from each sonde flight as it happens live. Node-RED can run on Windows or Linux (or Mac).
Lastly, note that the individual SDR line graphs will only be built in your web browser while the flight is happening. If you open your dashboard after the flight, only the elevation scatter plot will be populated. (And the main page table, radar and master elevation scatter plot). What most of us do is open all 4 SDR pages in the one browser when we want to log/watch a flight. Close them when done so the graph does not log flight after flight and use up your computers memory.
For installing the Node-RED software, their website has all you need to get running (Personal note, I have had nothing but trouble running it on Docker), Install Node-RED
To install node-red on Raspberry Pi
bash <(curl -sL https://raw.githubusercontent.com/node-red/linux-installers/master/deb/update-nodejs-and-nodered)
sudo systemctl enable nodered.service
node-red-start
That should get you up and running pretty quick. You just need to open a web browser to that computers IP address and port 1880.
Once you have that running the next task is to install the nodes we need.
Click on the Node-RED menu on the top right, then ‘Manage Pallet’. The click on the install tab and type ‘node-red-dashboard’. Wait for it to install, then search for ‘node-red-contrib-nostalgic’. Wait for that to install. Lastly search for ‘ui_table’ and install that one.
Next go to flows.nodered and import this FIFO subflow
Once you have those nodes installed, you can import the flow for the radiosonde dashboard.
Once imported, just add your home lat/lon and alt to the marked node. Get your SDR serial number(s) from the auto_rx webpage (hint, its the number after the # and there will be 1 for each SDR you have), then update your SDR serial numbers in the marked node, (hint, over write the 401 etc with your numbers, as many as you have) hit the big red deploy in the top right as usual.
Open a new tab and go to that computers IP:1880/ui/ and wait for your first flight. Hint, page menu is in the top left. Open the SDR ones and leave them open to view flight data. Refresh that tab when you want to start logging again.